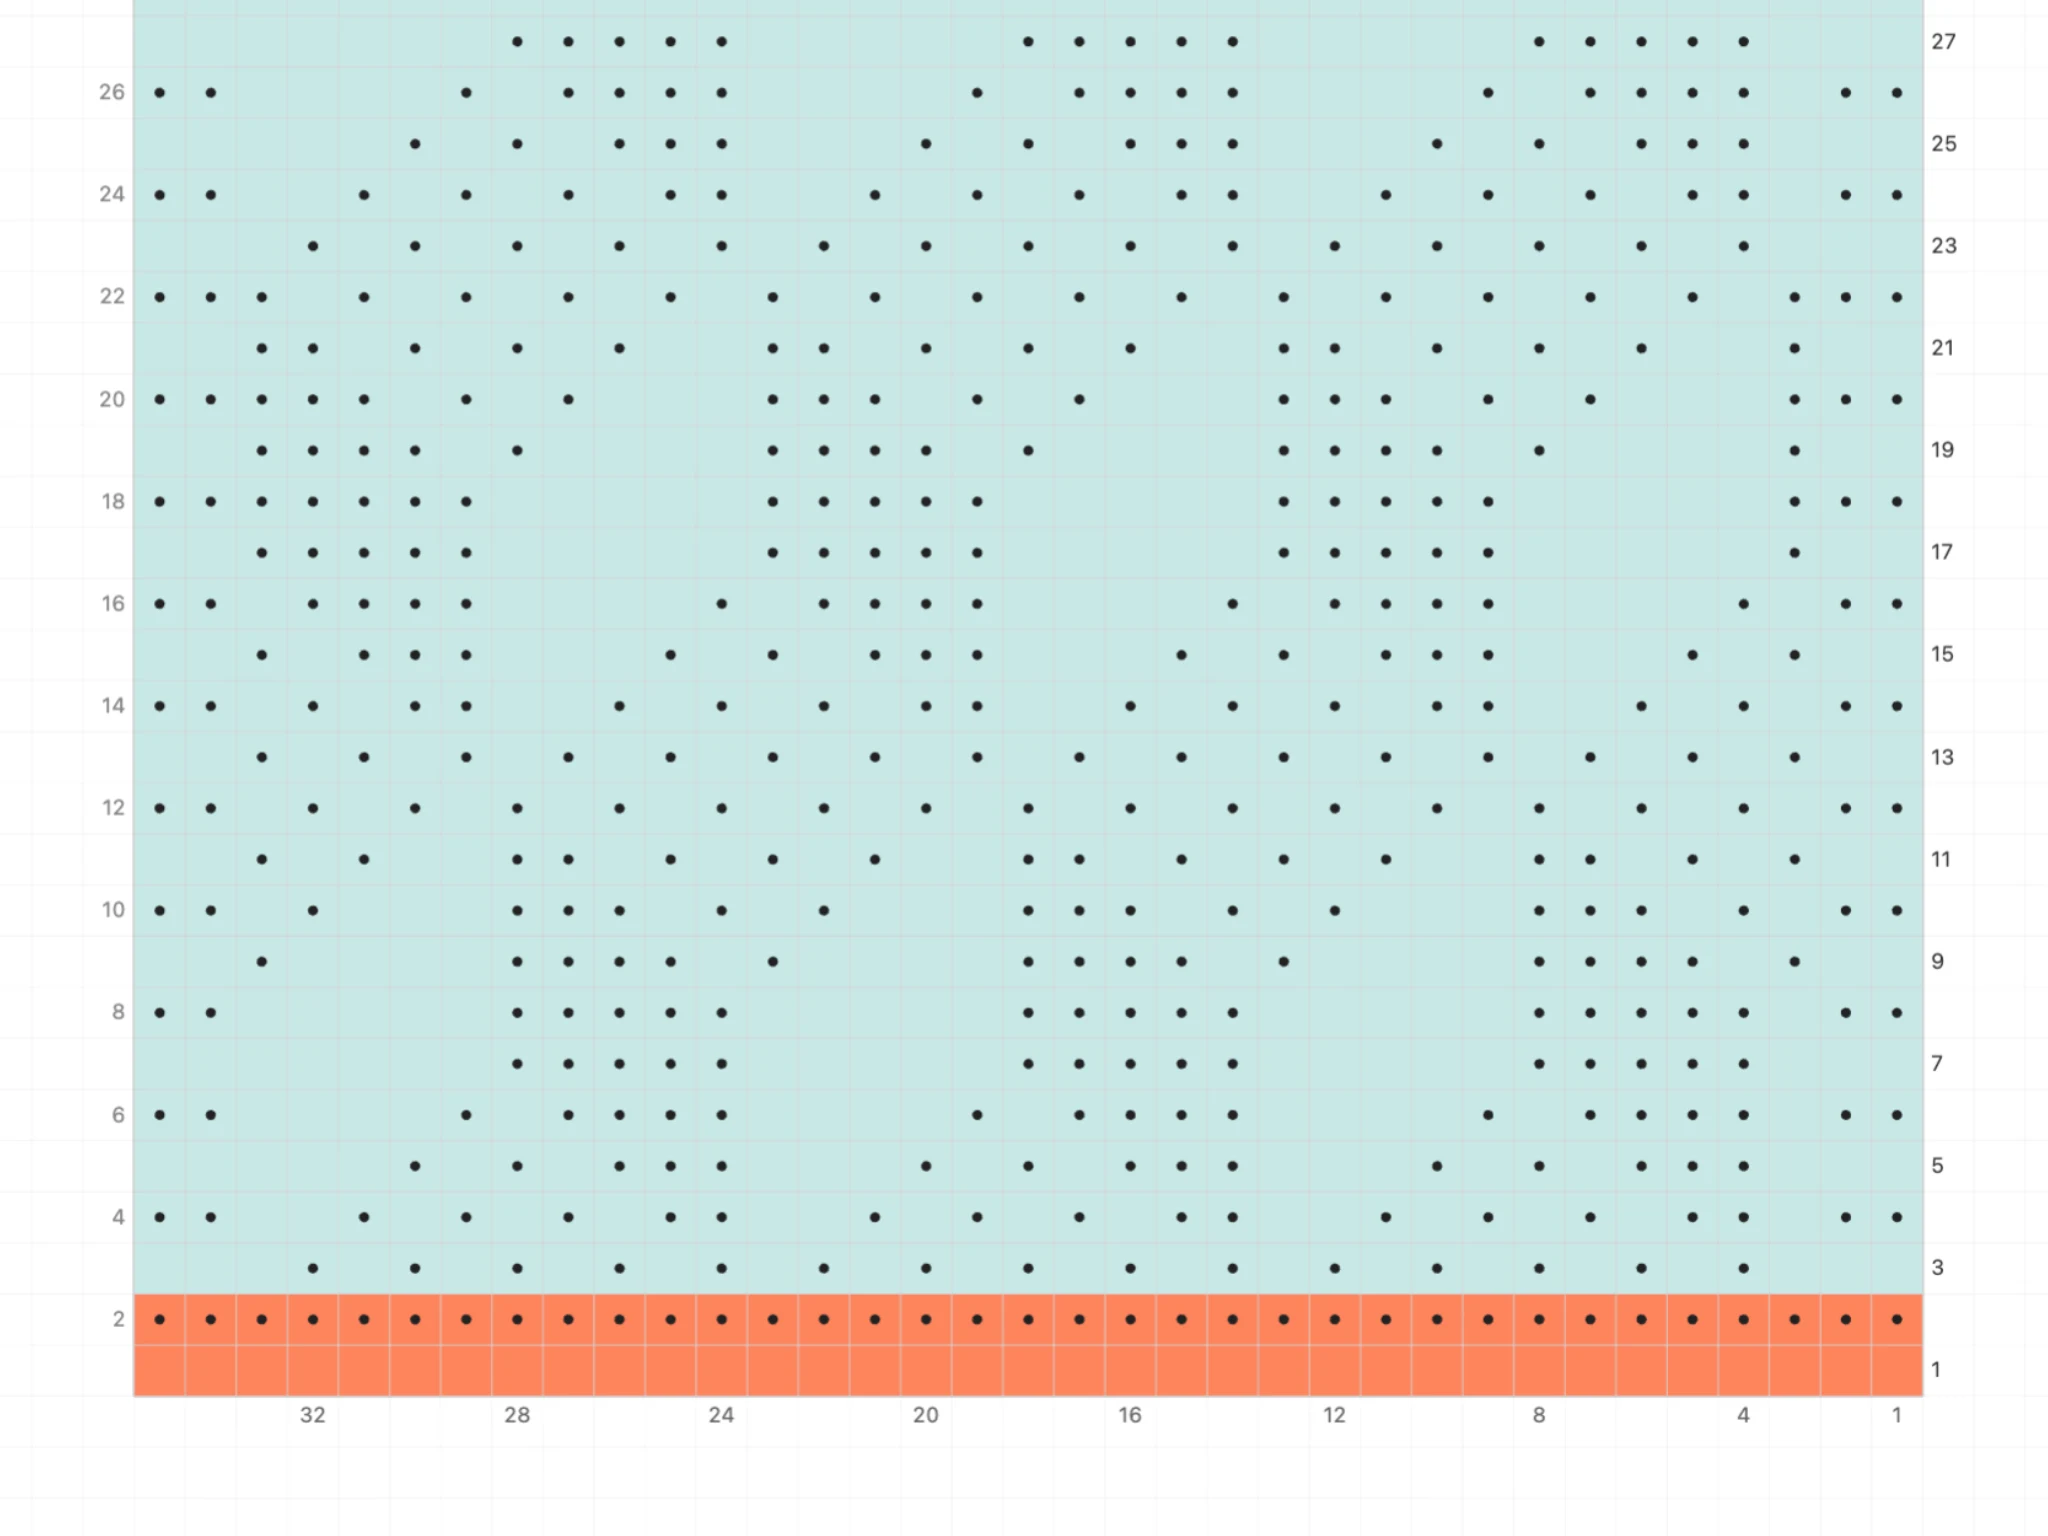
Welcome to Asunder Knit! In this tutorial, you will learn the basic skills to start drafting your knitting projects in software.
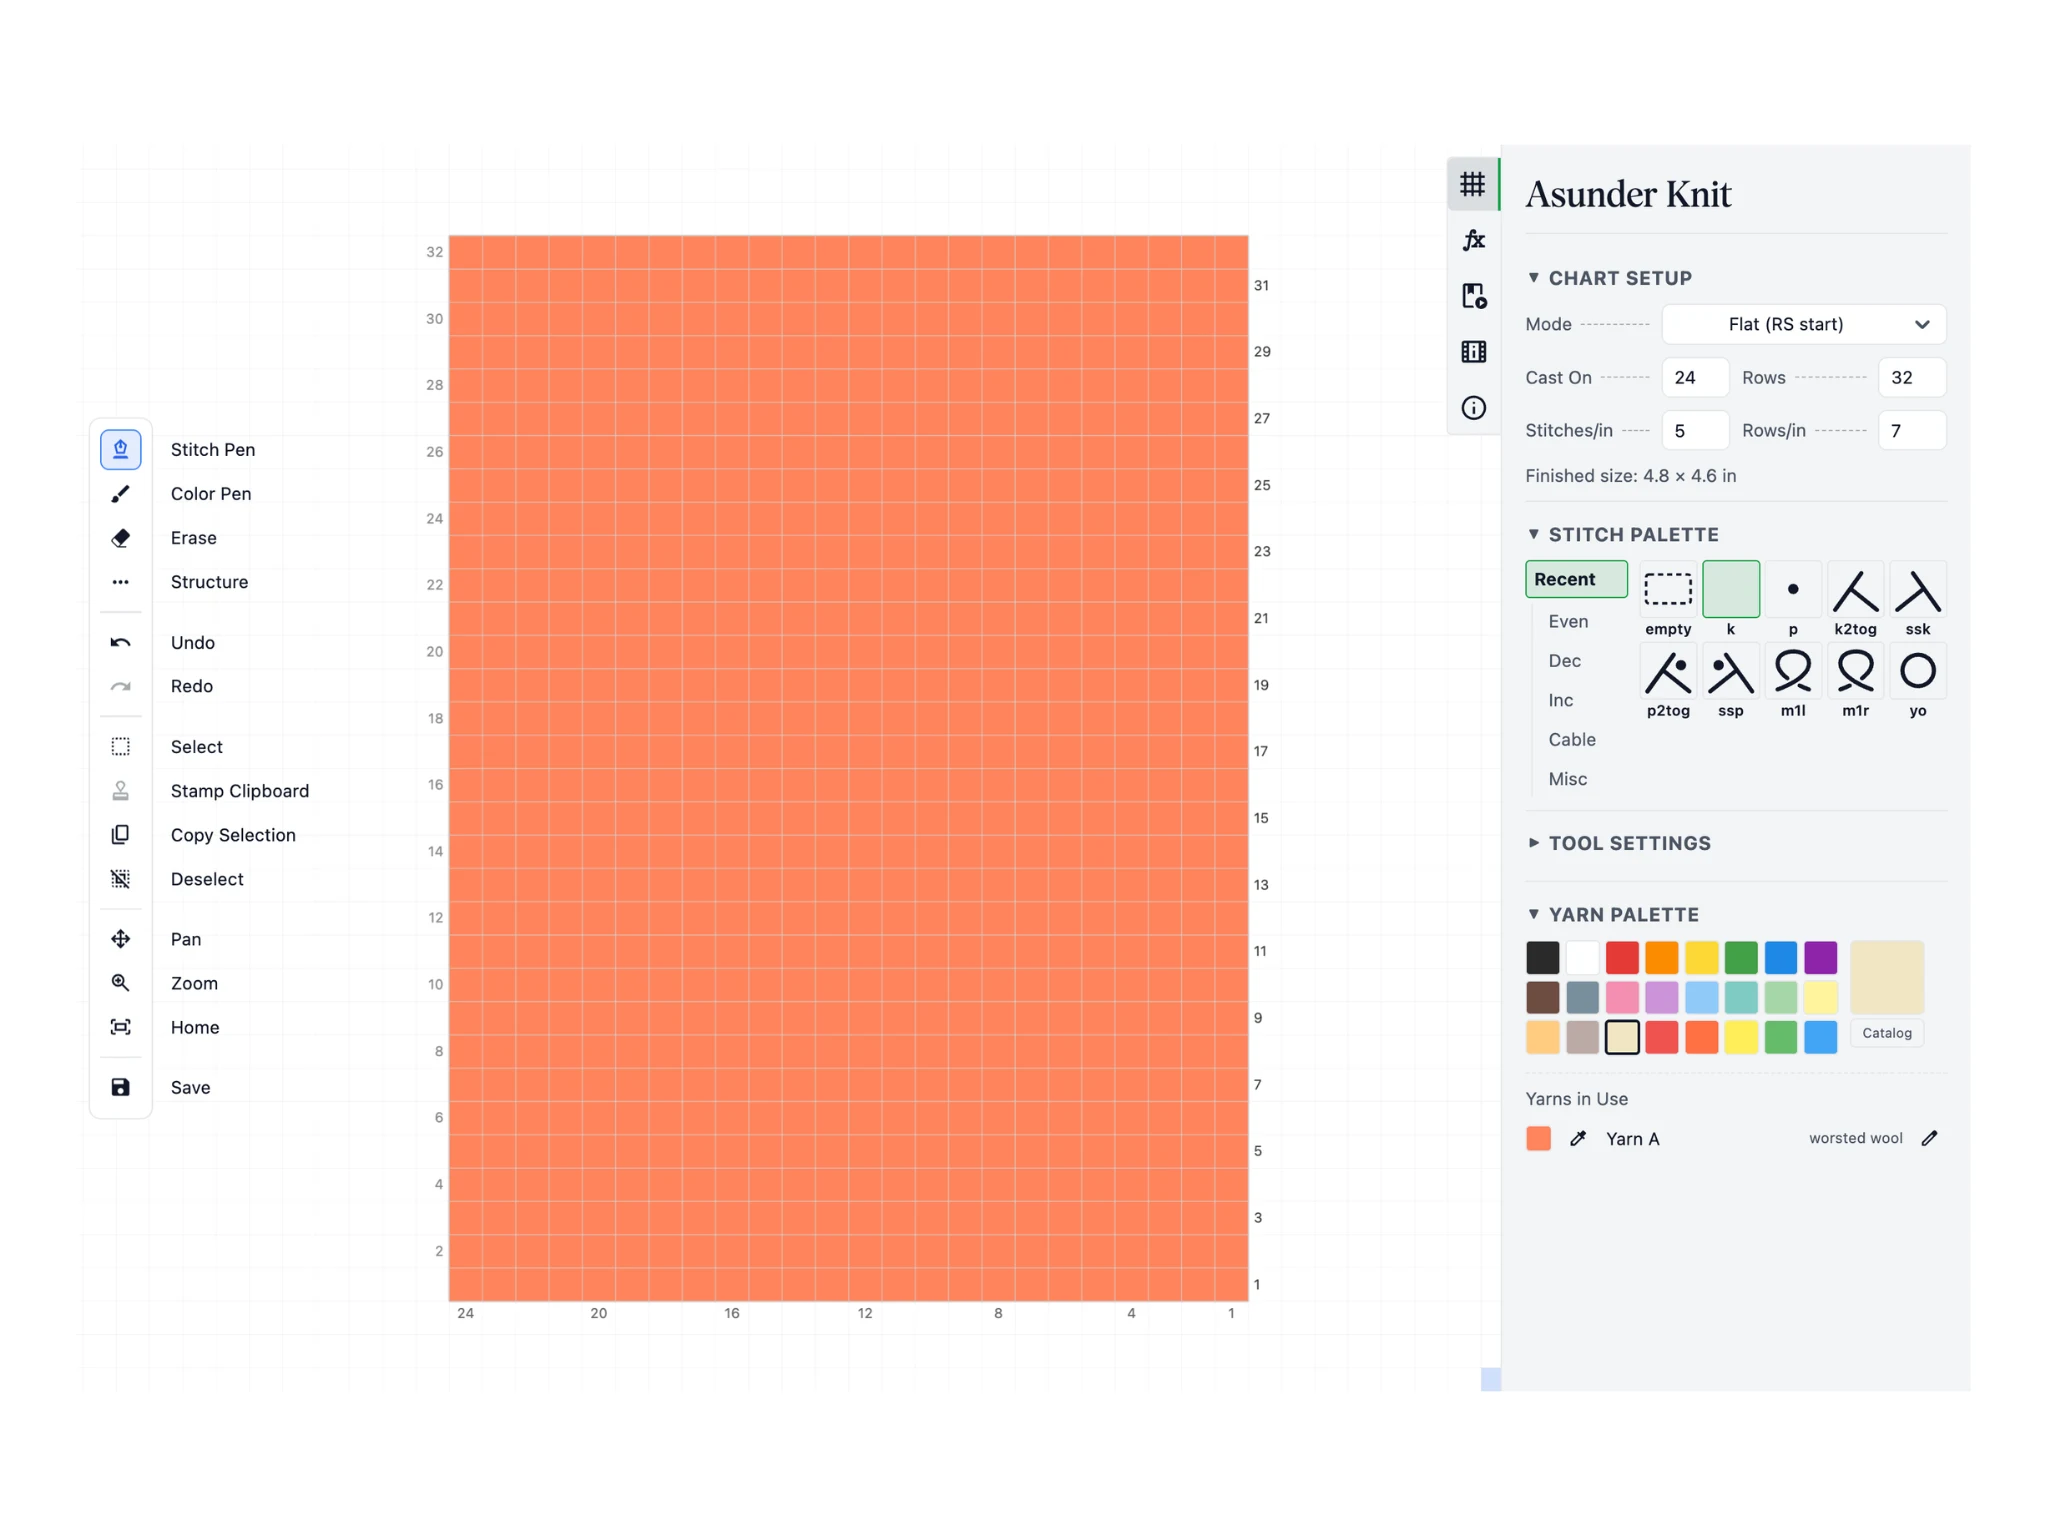
This is your starting screen. The Asunder Knit interface is organized into a toolbar on the left, the editor in the center, and a properties pane on the right.
The toolbar contains a variety of tools that you use to edit the chart. These tools are used in the editor which contains the knitting chart against a grid background. Finally, the properties panel has options to configure your tools, chart, and additional actions for charting.
This is a lot, but don't worry! It is easy to get started in Asunder Knit and you can level up into the more advanced features as you follow our tutorials.
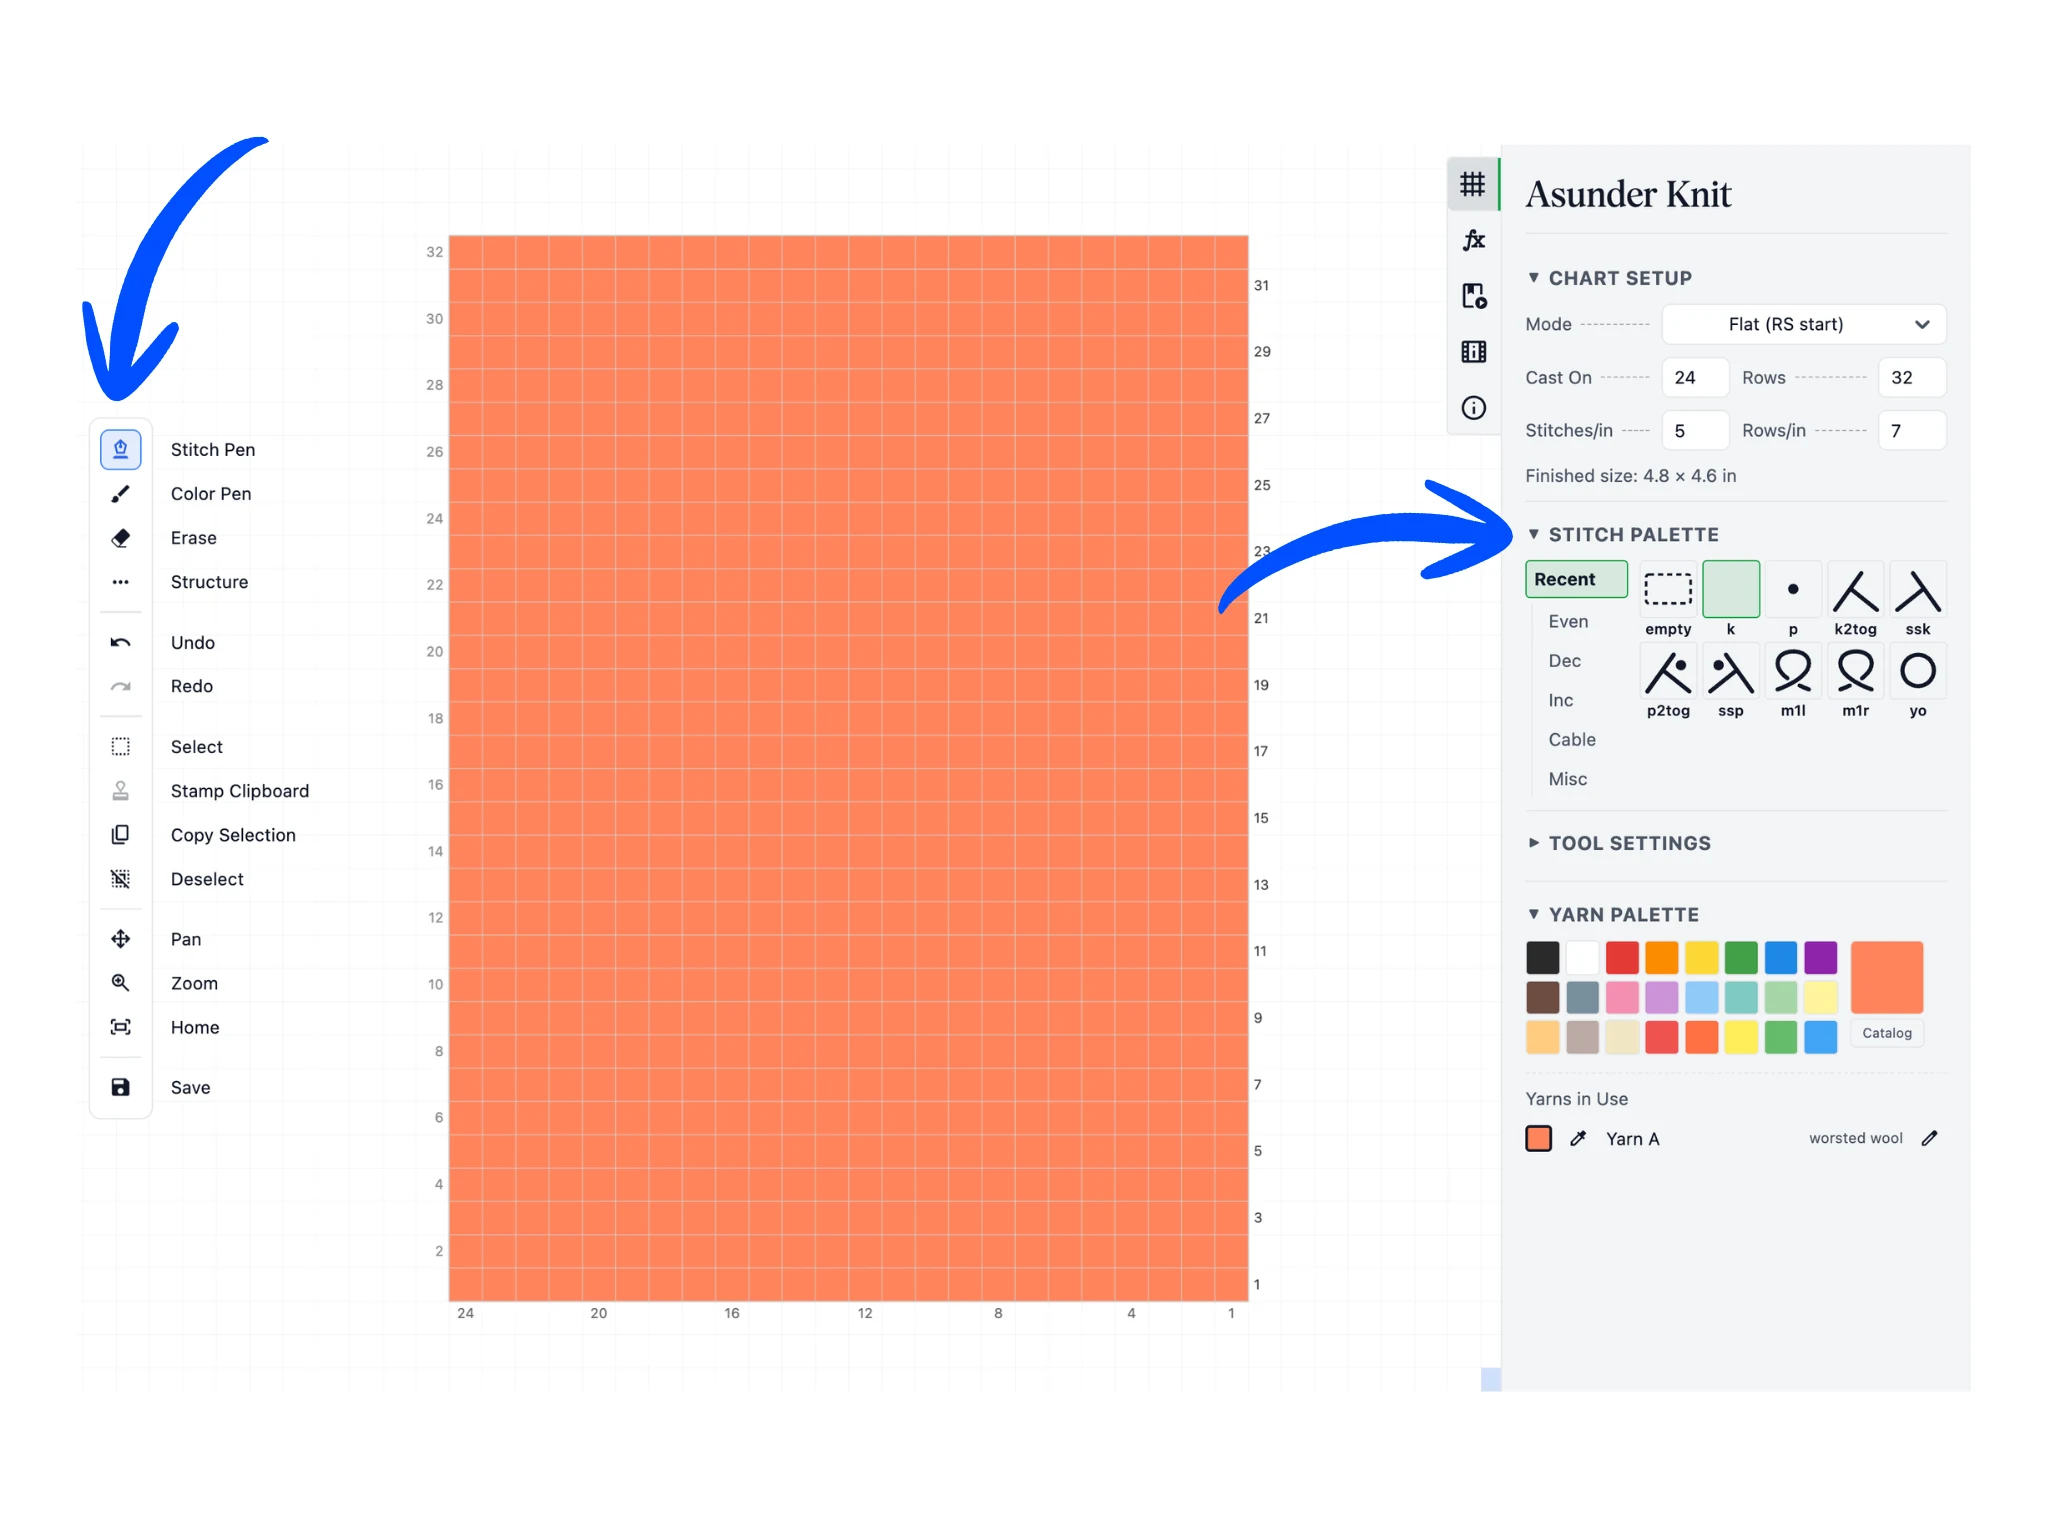
Notice when you start out in Asunder Knit, the Stitch Pen tool is selected by default in the toolbar. It will allow you to draw stitches in the knitting chart. The default stitch is set to knit.
Note that on project start, you can choose whether to notate knits/purls with dashes or with blank/dot.
You can choose which stitch you want in the stitch palette in the properties pane. It starts in the "Recent" category, pre-loaded with commonly used stitches. You can access more stitch types in the other categories like "Even", "Dec" for decreases, "Inc" for increases, and so on.
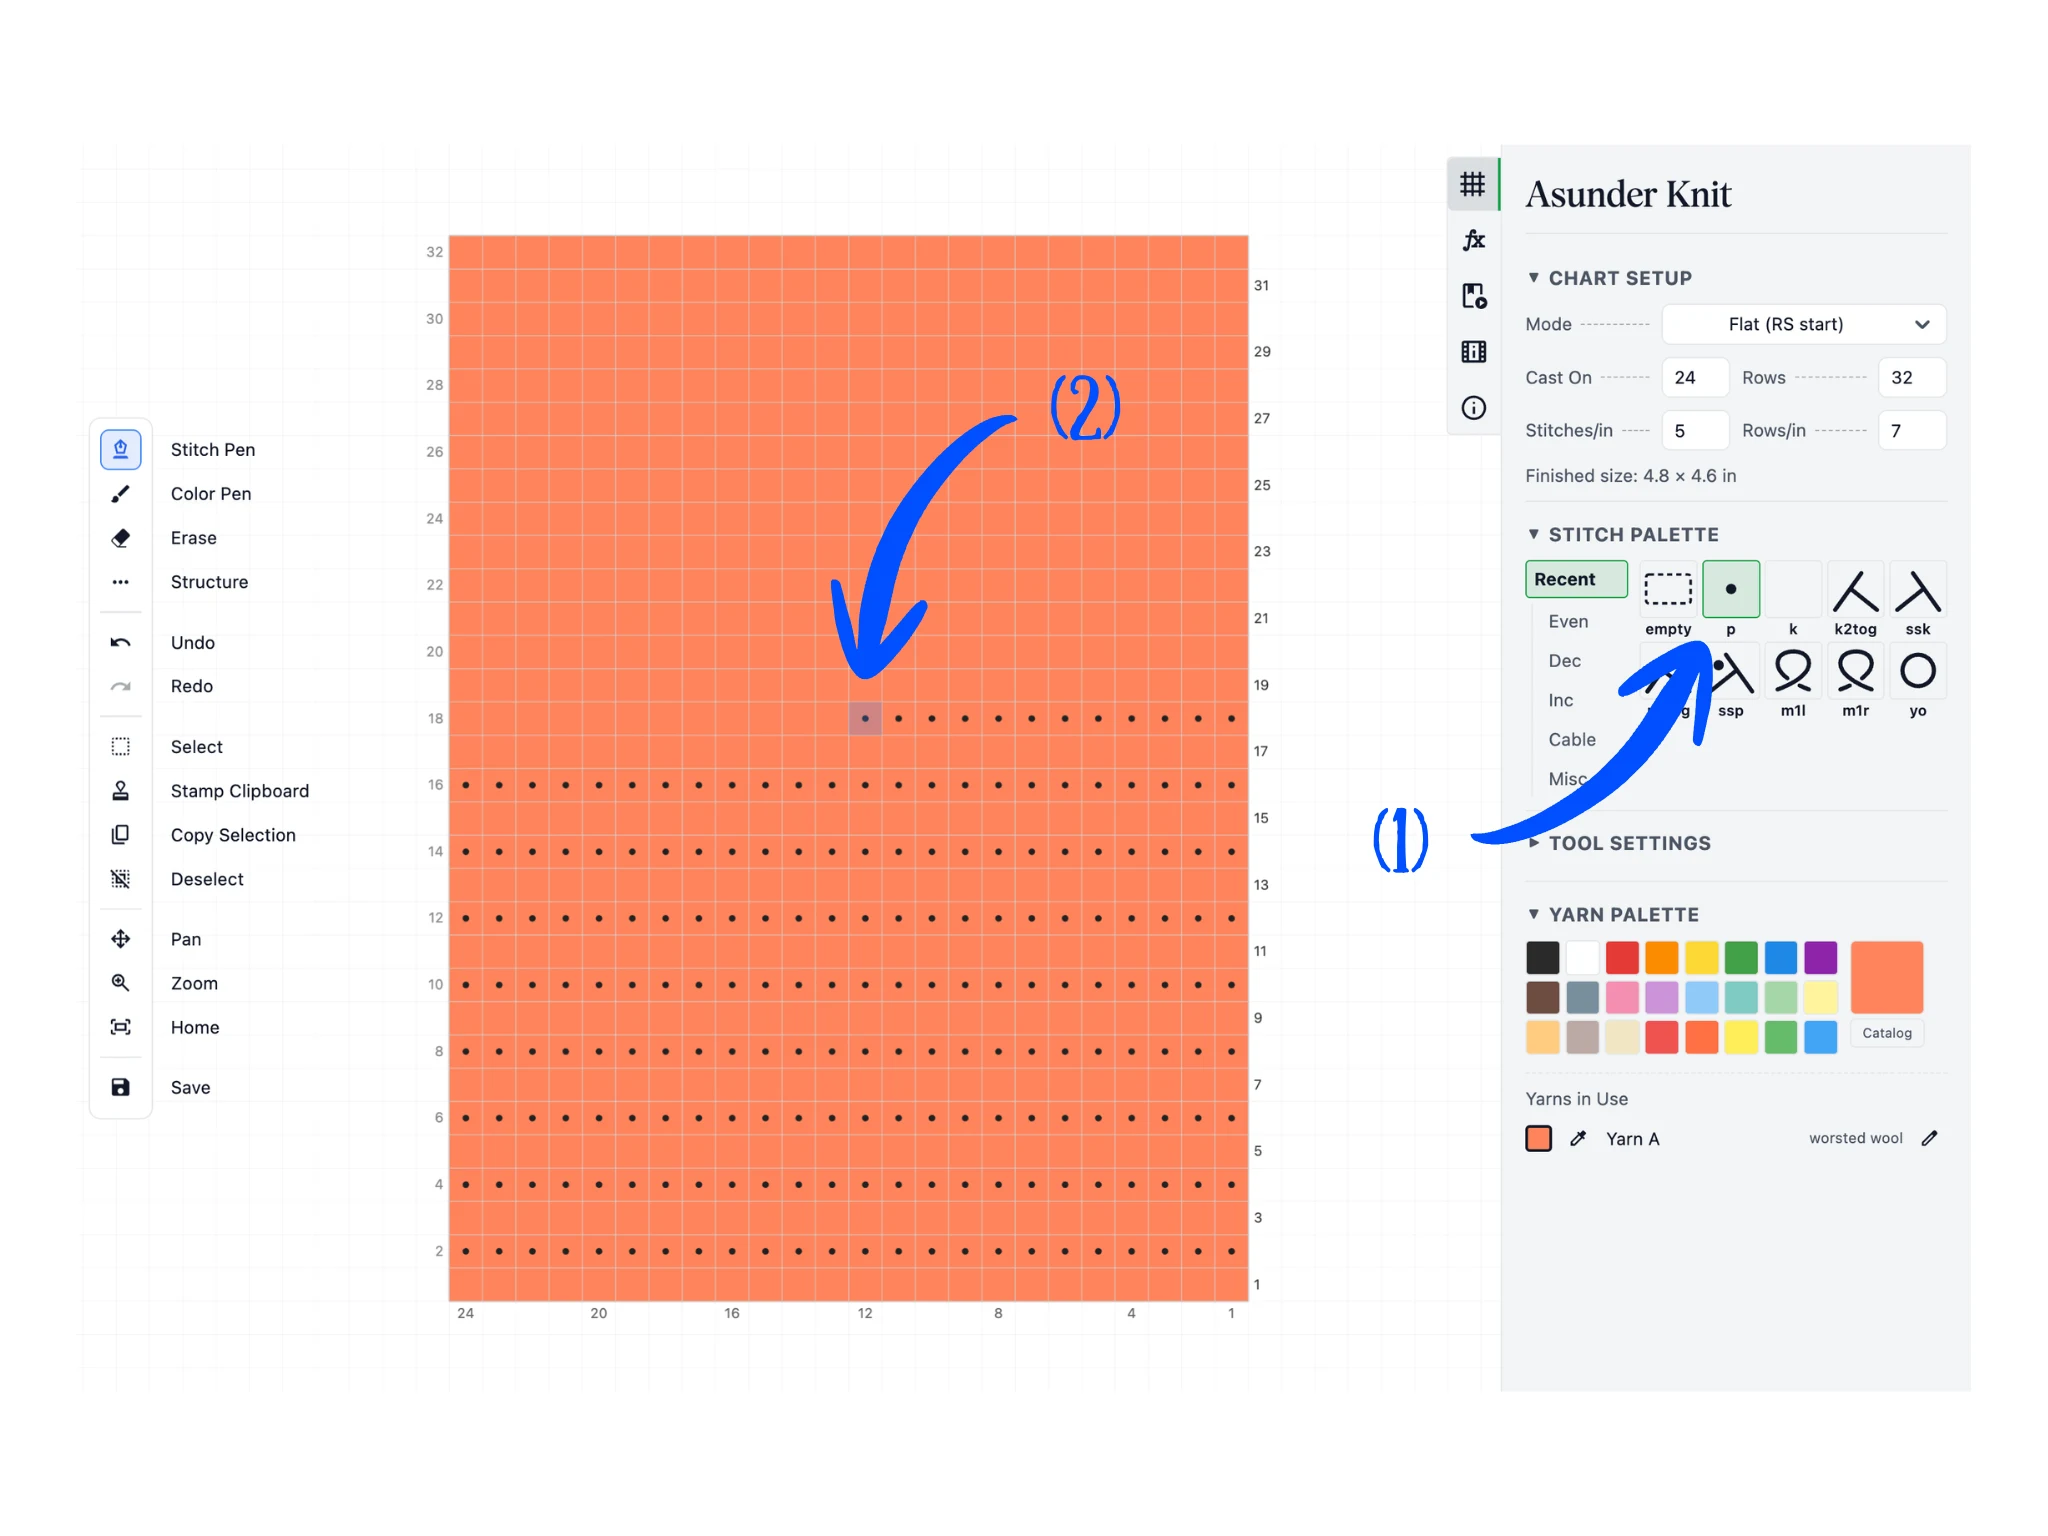
Use the stitch palette and change the active stitch to a purl by clicking on the respective icon (1).
Then, you can left-click on the chart's grid cells to begin setting stitches (2). In this tutorial step, I'm changing the default stockinette (all knits) to a garter stitch. Left-click and drag can help you place stitches like you are drawing them.
Notice that in knitting charts, we default to showing stitches on the right side, regardless of whether we are in a RS or WS row. For instance, when we knit WS rows, we purl while hand-knitting -- and notice the front side (backside) of the WS row is still knits. Therefore, all cells are denoted knit for stockinette in a chart.
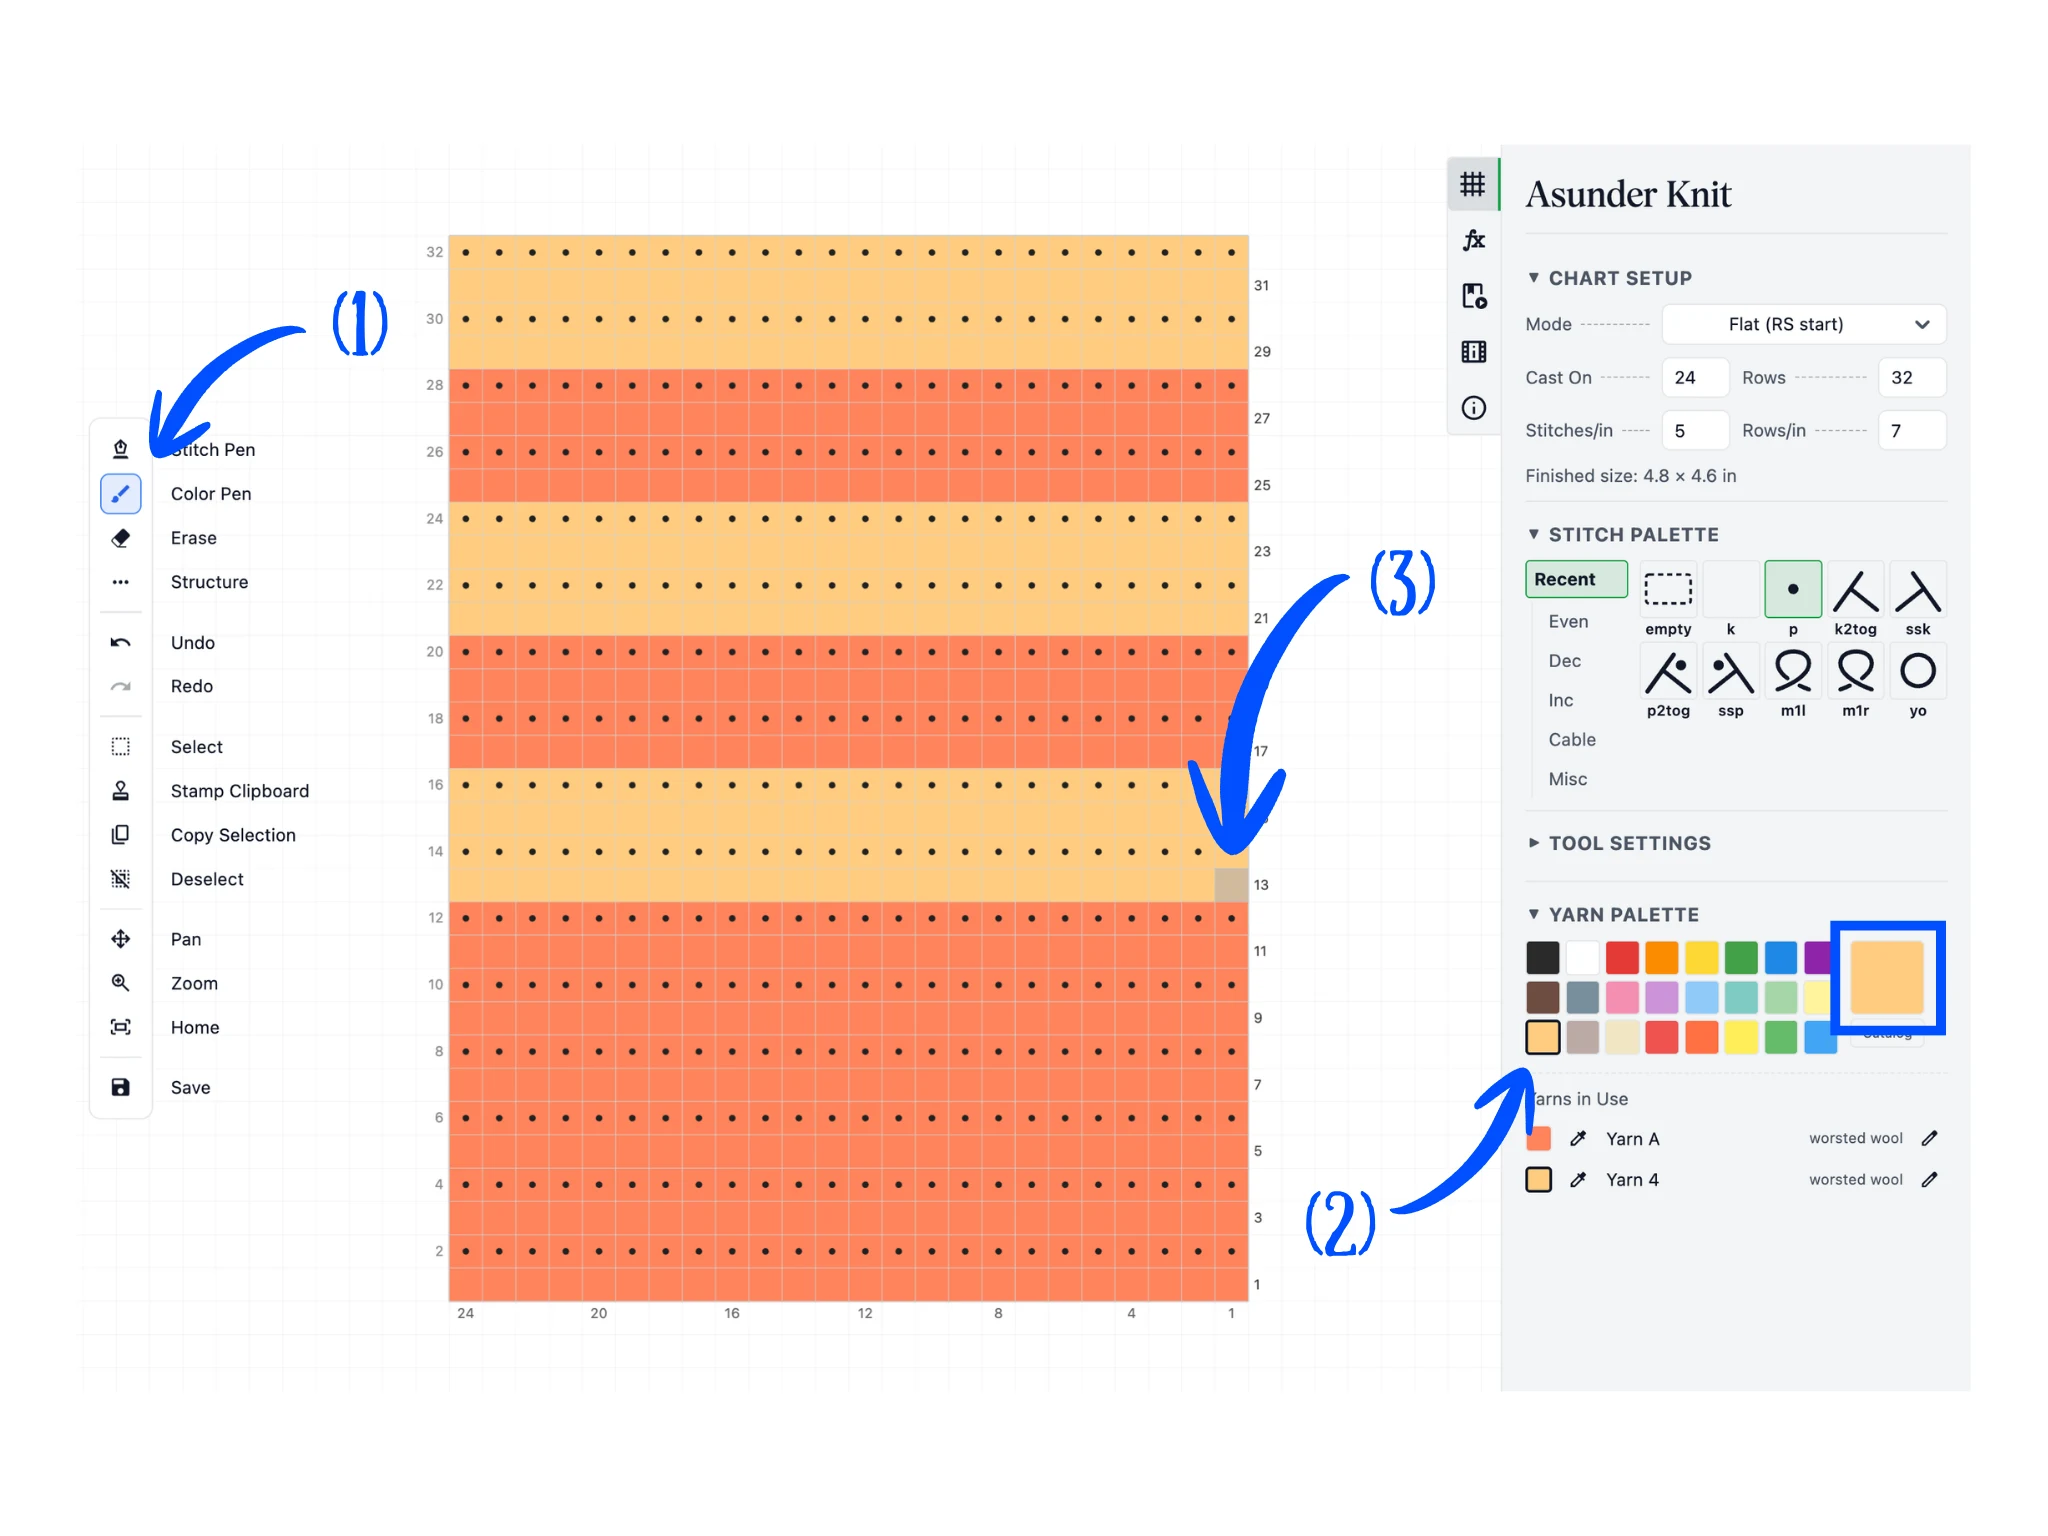
Next, you change the color of each stitch (e.g. for colorwork) using the Color Pen tool in the toolbar (1). The Color Pen tool draws whatever the app's active color is into the chart cells.
In the properties pane, notice near the bottom is the Yarn Palette section. The app's active color is shown in the big colored square. Here, you can click on a preset color (2) to change the active color.
Once you've chosen a color you like, in this case I've picked a yellow, you can use the Color Pen in the chart (3) like you did with the Stitch Pen. This time, it only changes the background color of each stitch.
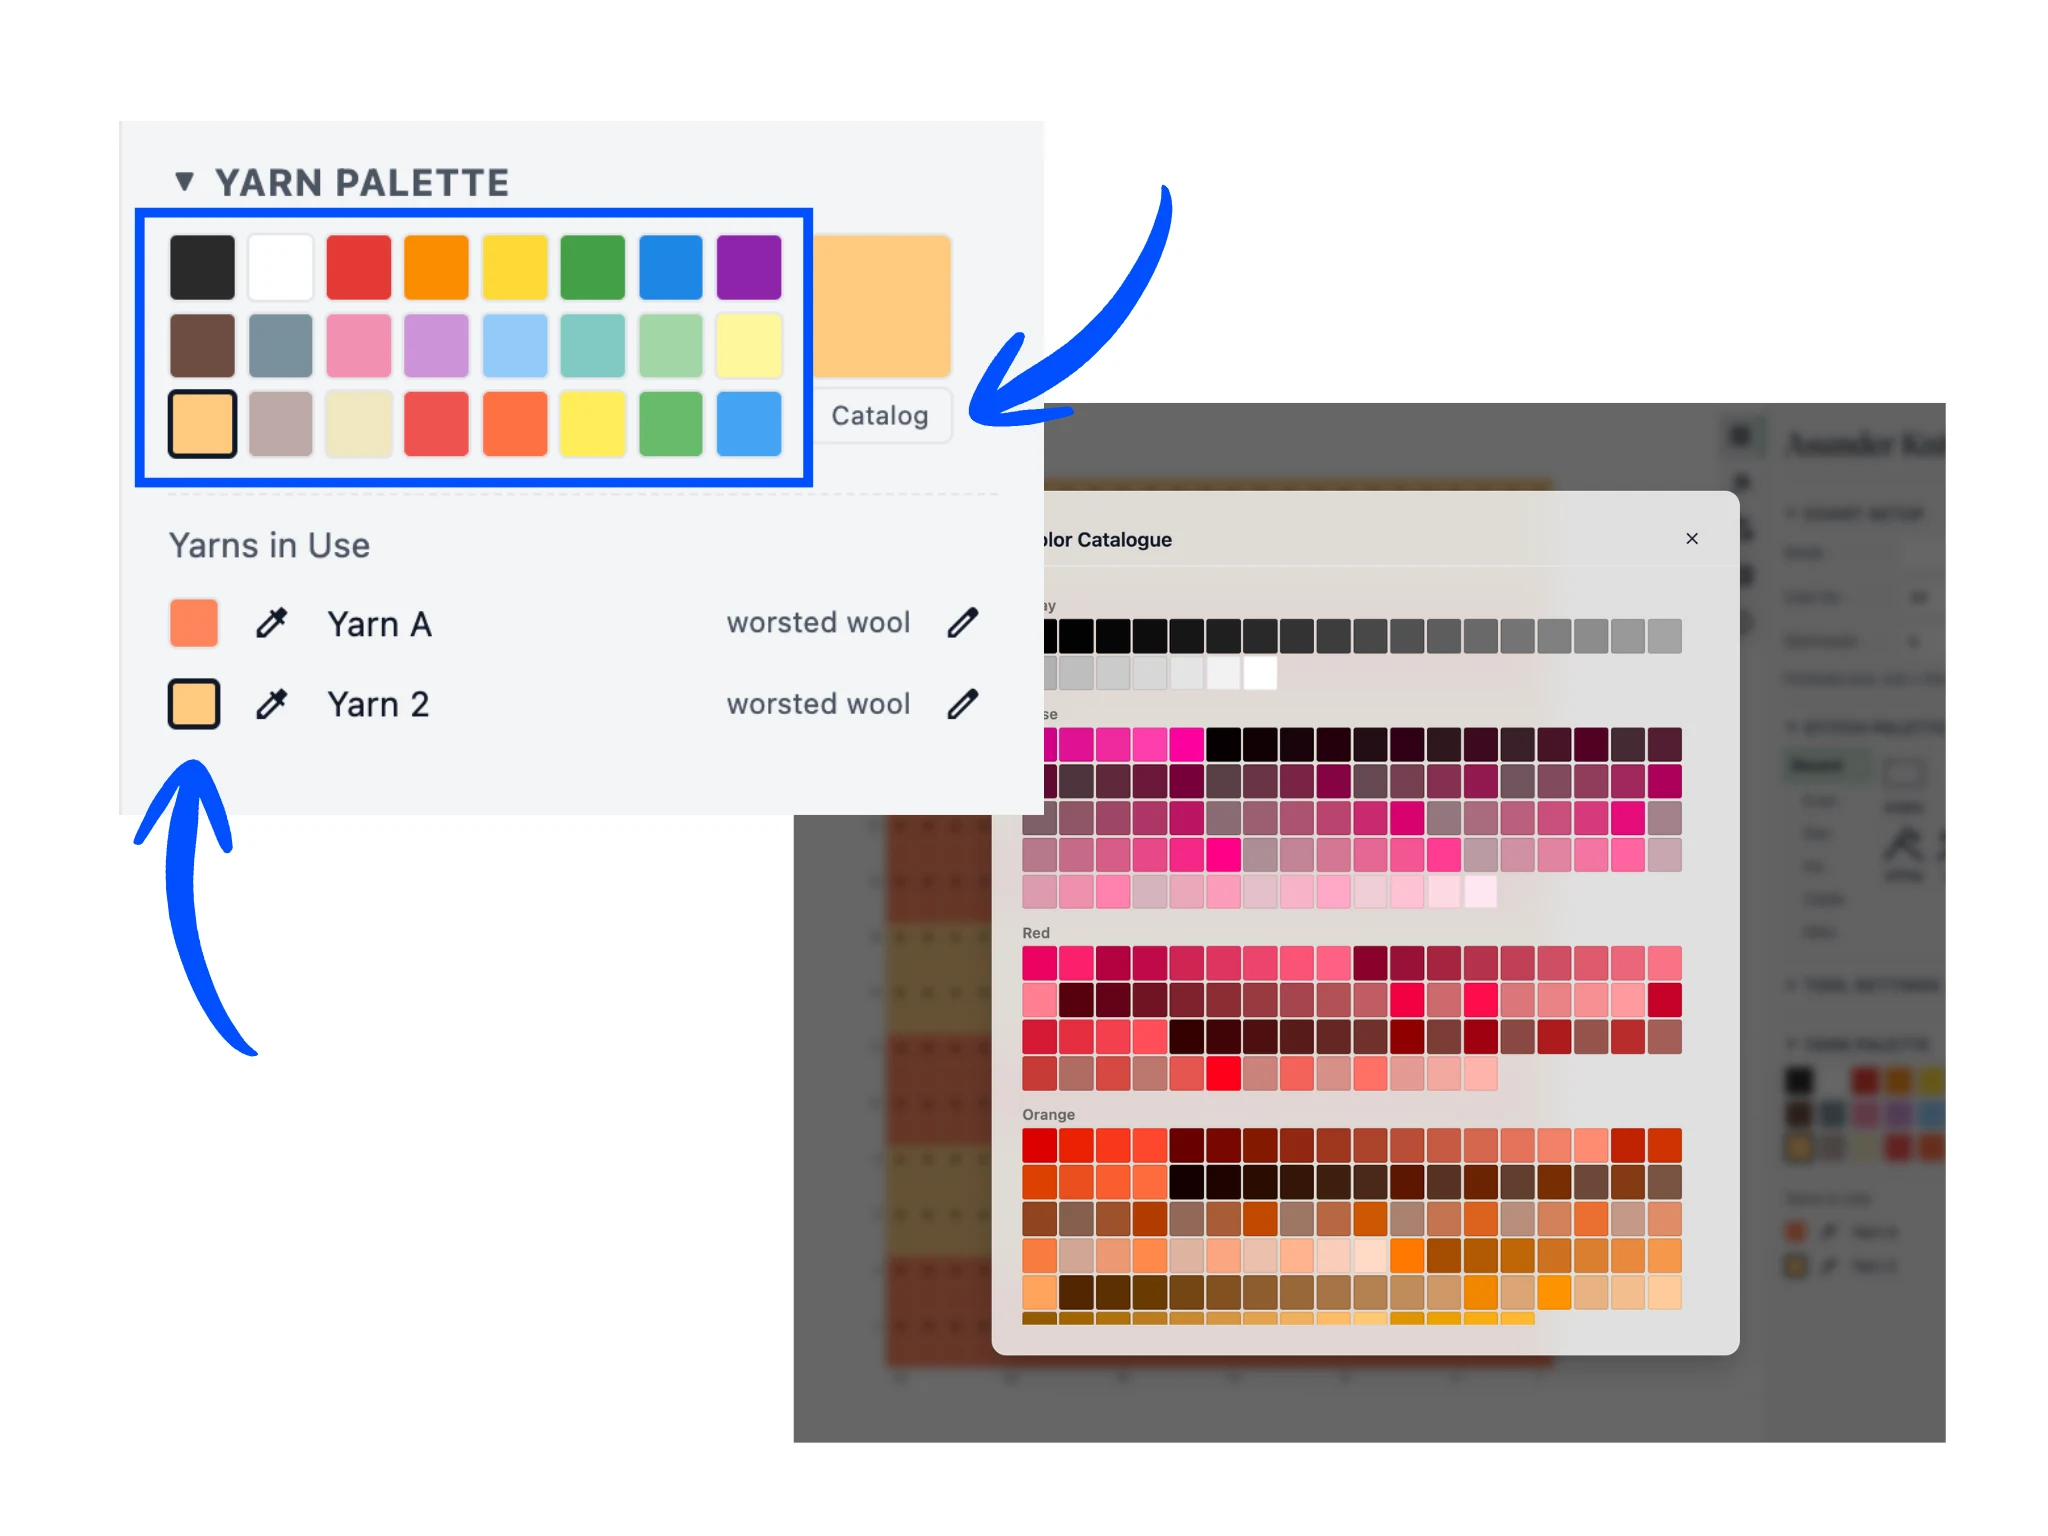
You can change the active color by choosing one of our 24 preset color options in the Yarn Palette. This is outlined in blue inside the tutorial image.
You can also choose from 1000+ colors in our scrollable catalog, opened by the Catalog button under the active color square.
Finally, you can quickly swap between your project colors by clicking on the small color chips under the "Yarns in use" subsection. A color is only added to this subsection if it is present in the chart.
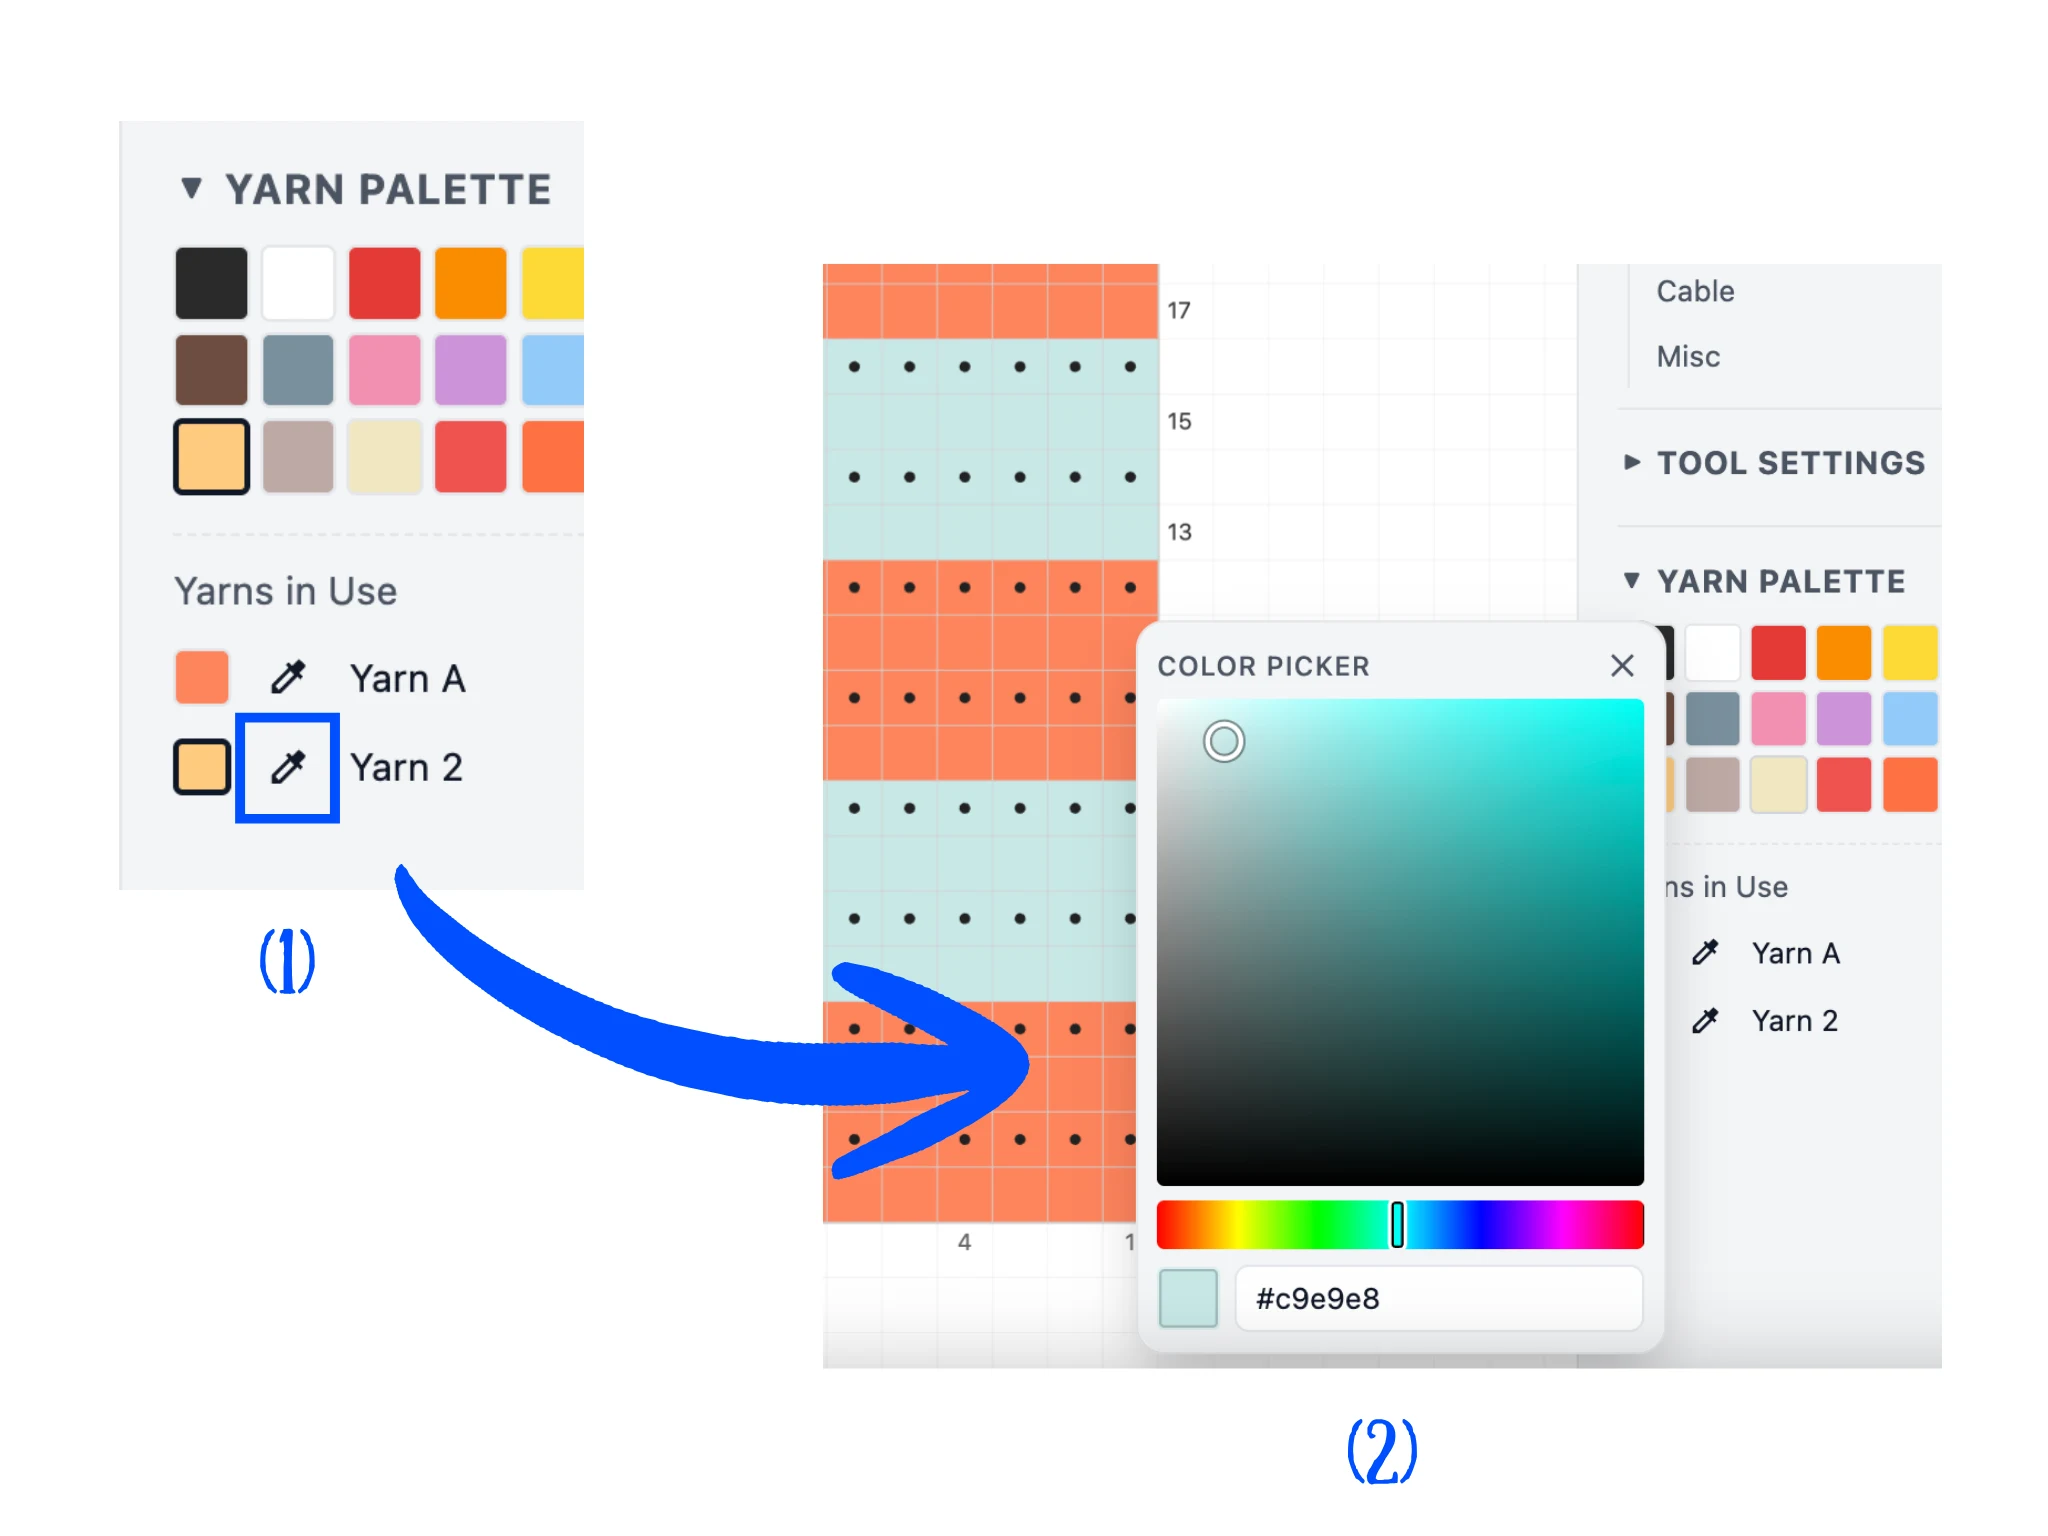
You can also modify one of the colors that are currently in use. The colors under the "Yarns in use" subsection have an eyedropper button to the right of each square color chip (1).
When you click on such an eyedropper button, a color picker will appear. You can change the hue, saturation, and value of the color and see your chart recolor accordingly (2).
Use this feature to tune the color of your knitting design.
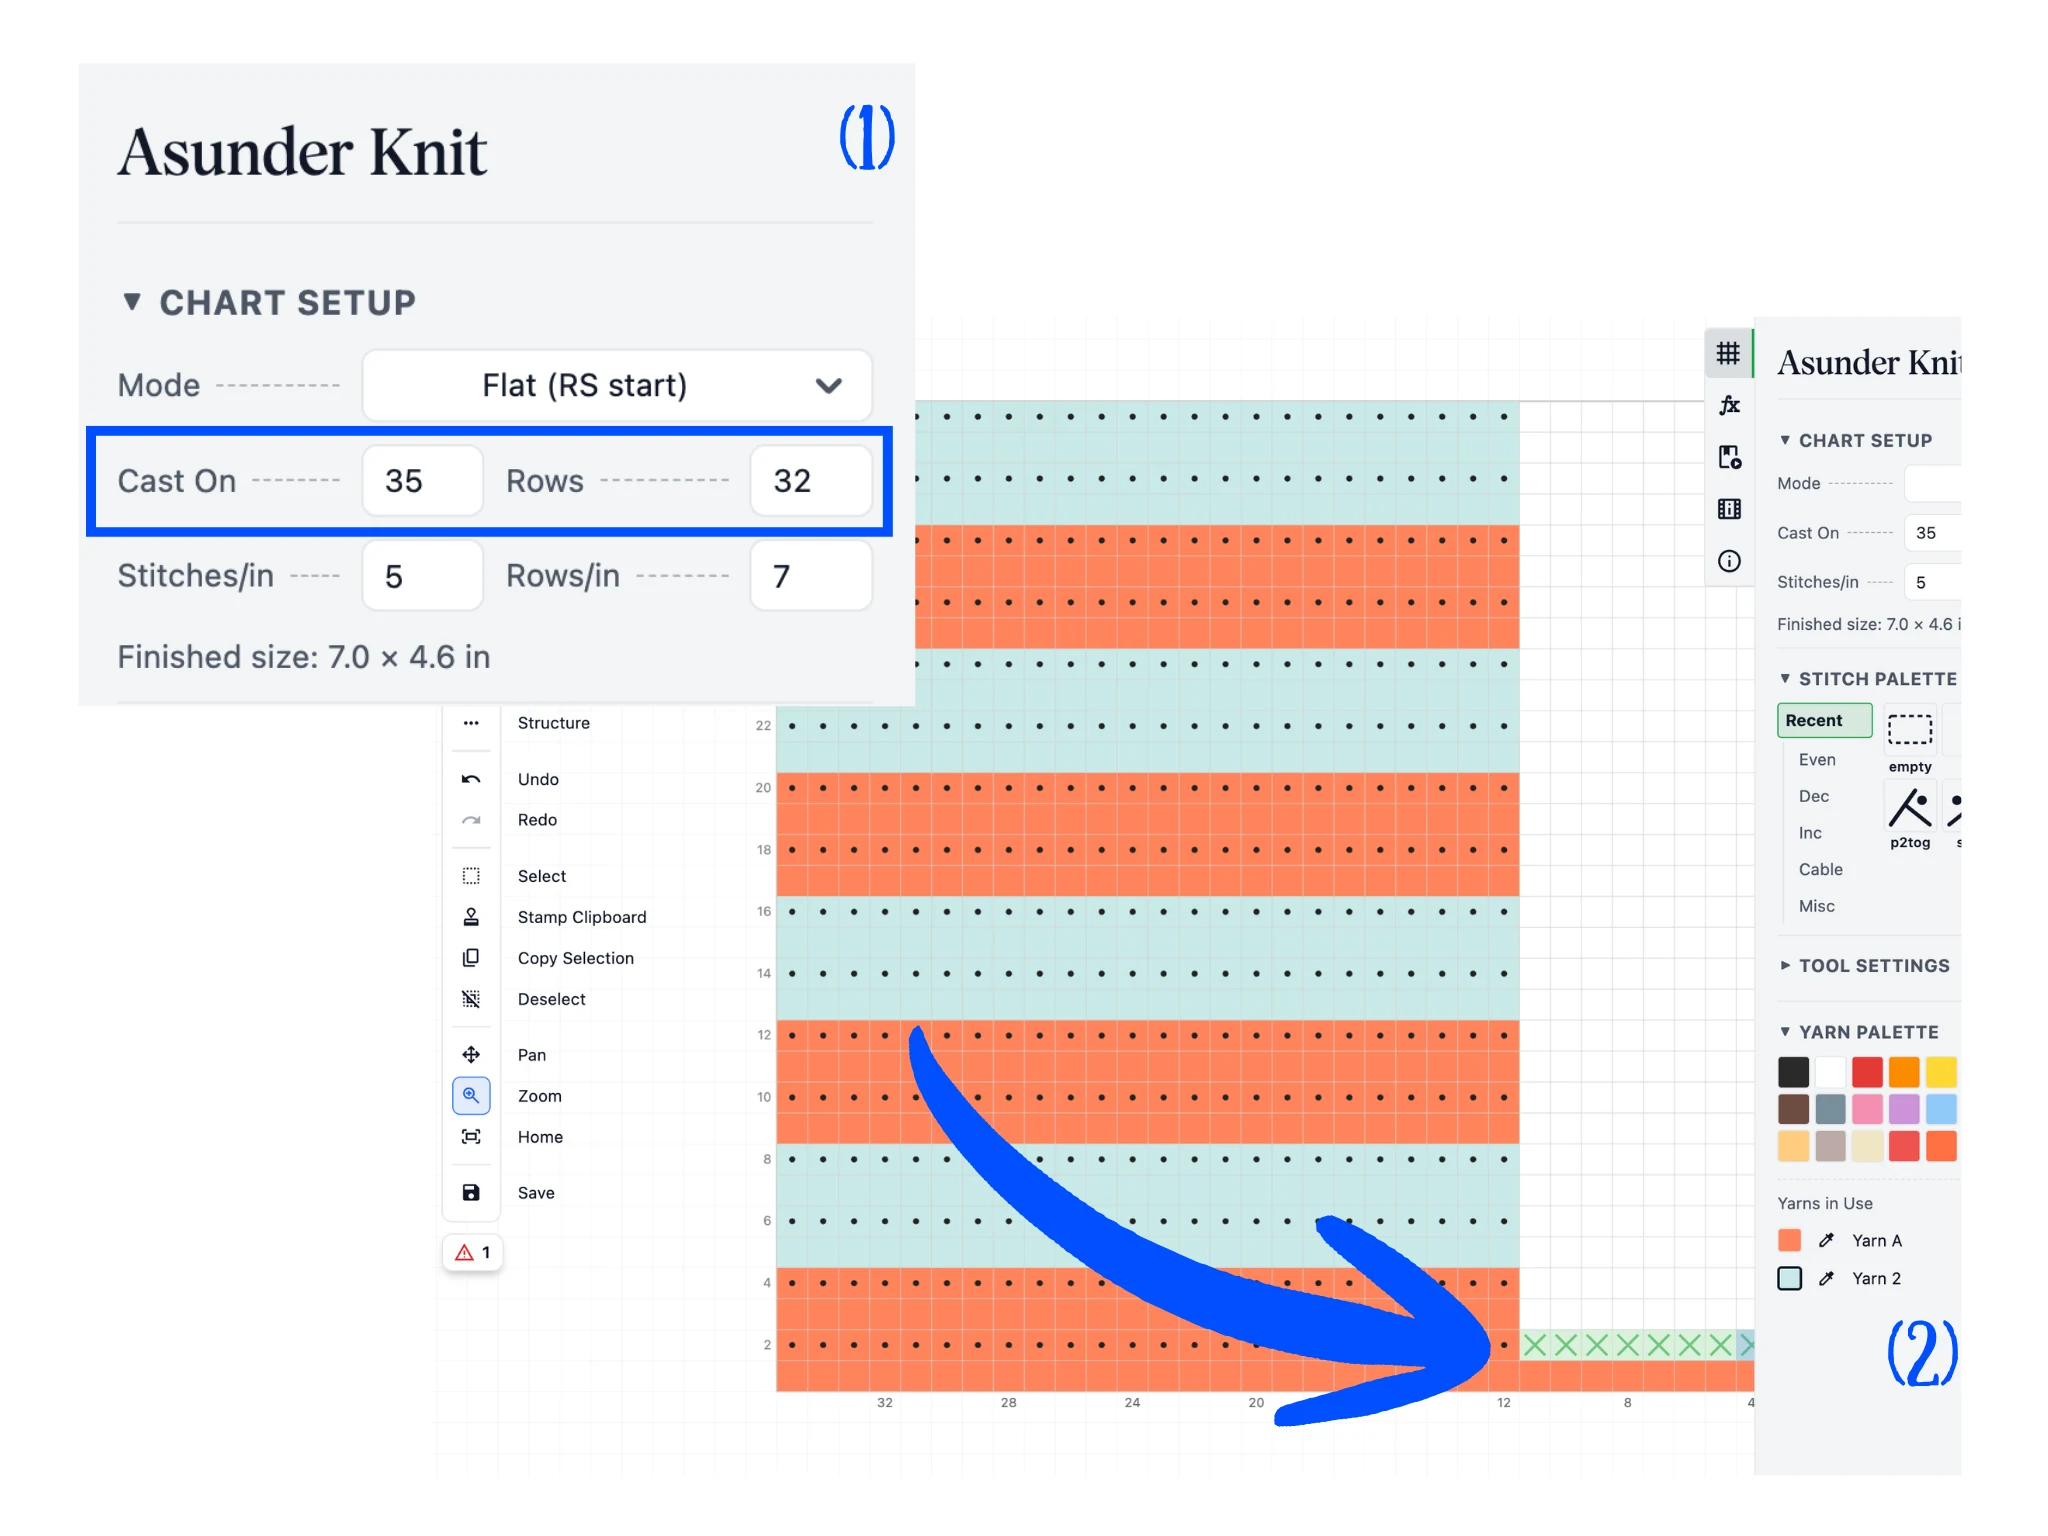
Next, let us visit the Chart Setup section in the properties panel on the top-right. This is where we configure the chart to match your project goals.
We can adjust the size of the project by changing the number of cast-ons and rows. For the purposes of this tutorial, we've set them to 35 and 32 respectively. Here, you can also change the gauge and change between knitting modes (covered in advanced tutorials).
Notice that when you resize the chart, it automatically adds cast-ons but will not fill in the new area with stitches. The chart may also go off-screen.
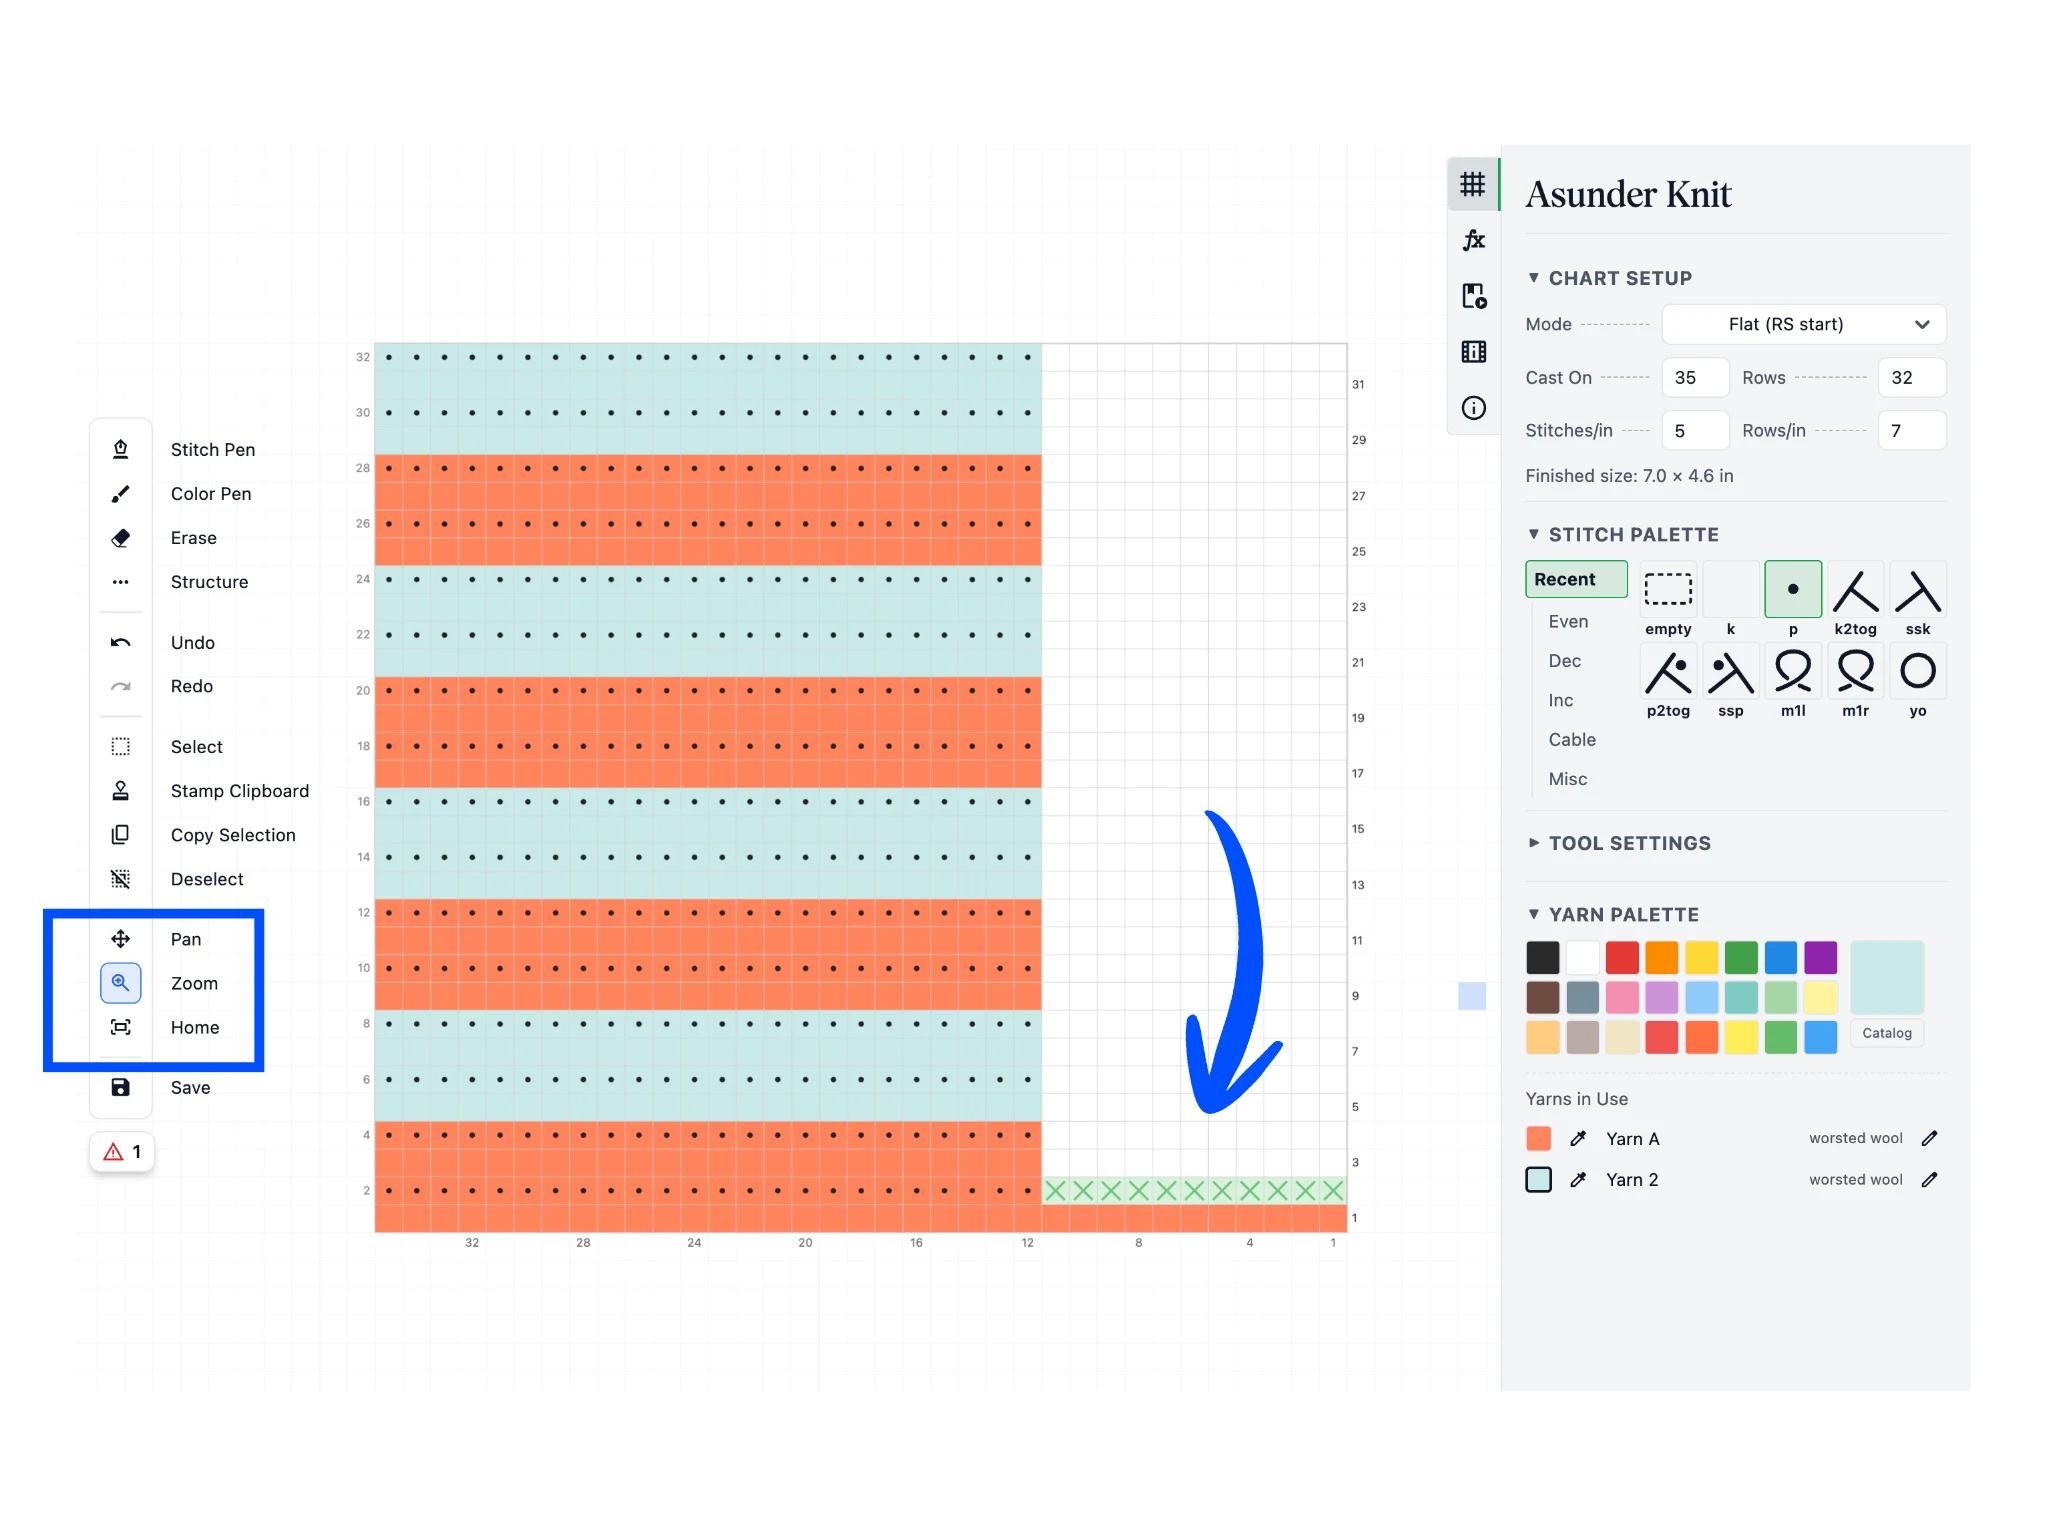
In the toolbar, you can use the Pan and Zoom tools to navigate the chart editor with left-click and drag. You can use the Home tool button as a shortcut to see the entire chart on your screen.
Holding down your spacebar is a shortcut to pan temporarily. You can also use your mouse scrolling to zoom in and out.
You can see the "X"s that appear on the chart -- these denote a problem. Asunder Knit automatically validates your chart and checks for errors. Green and red "X"s mean there's a stitch count error (not enough or too many in a row). Here, it's telling us we need to add more stitches to match the new number of cast-ons.
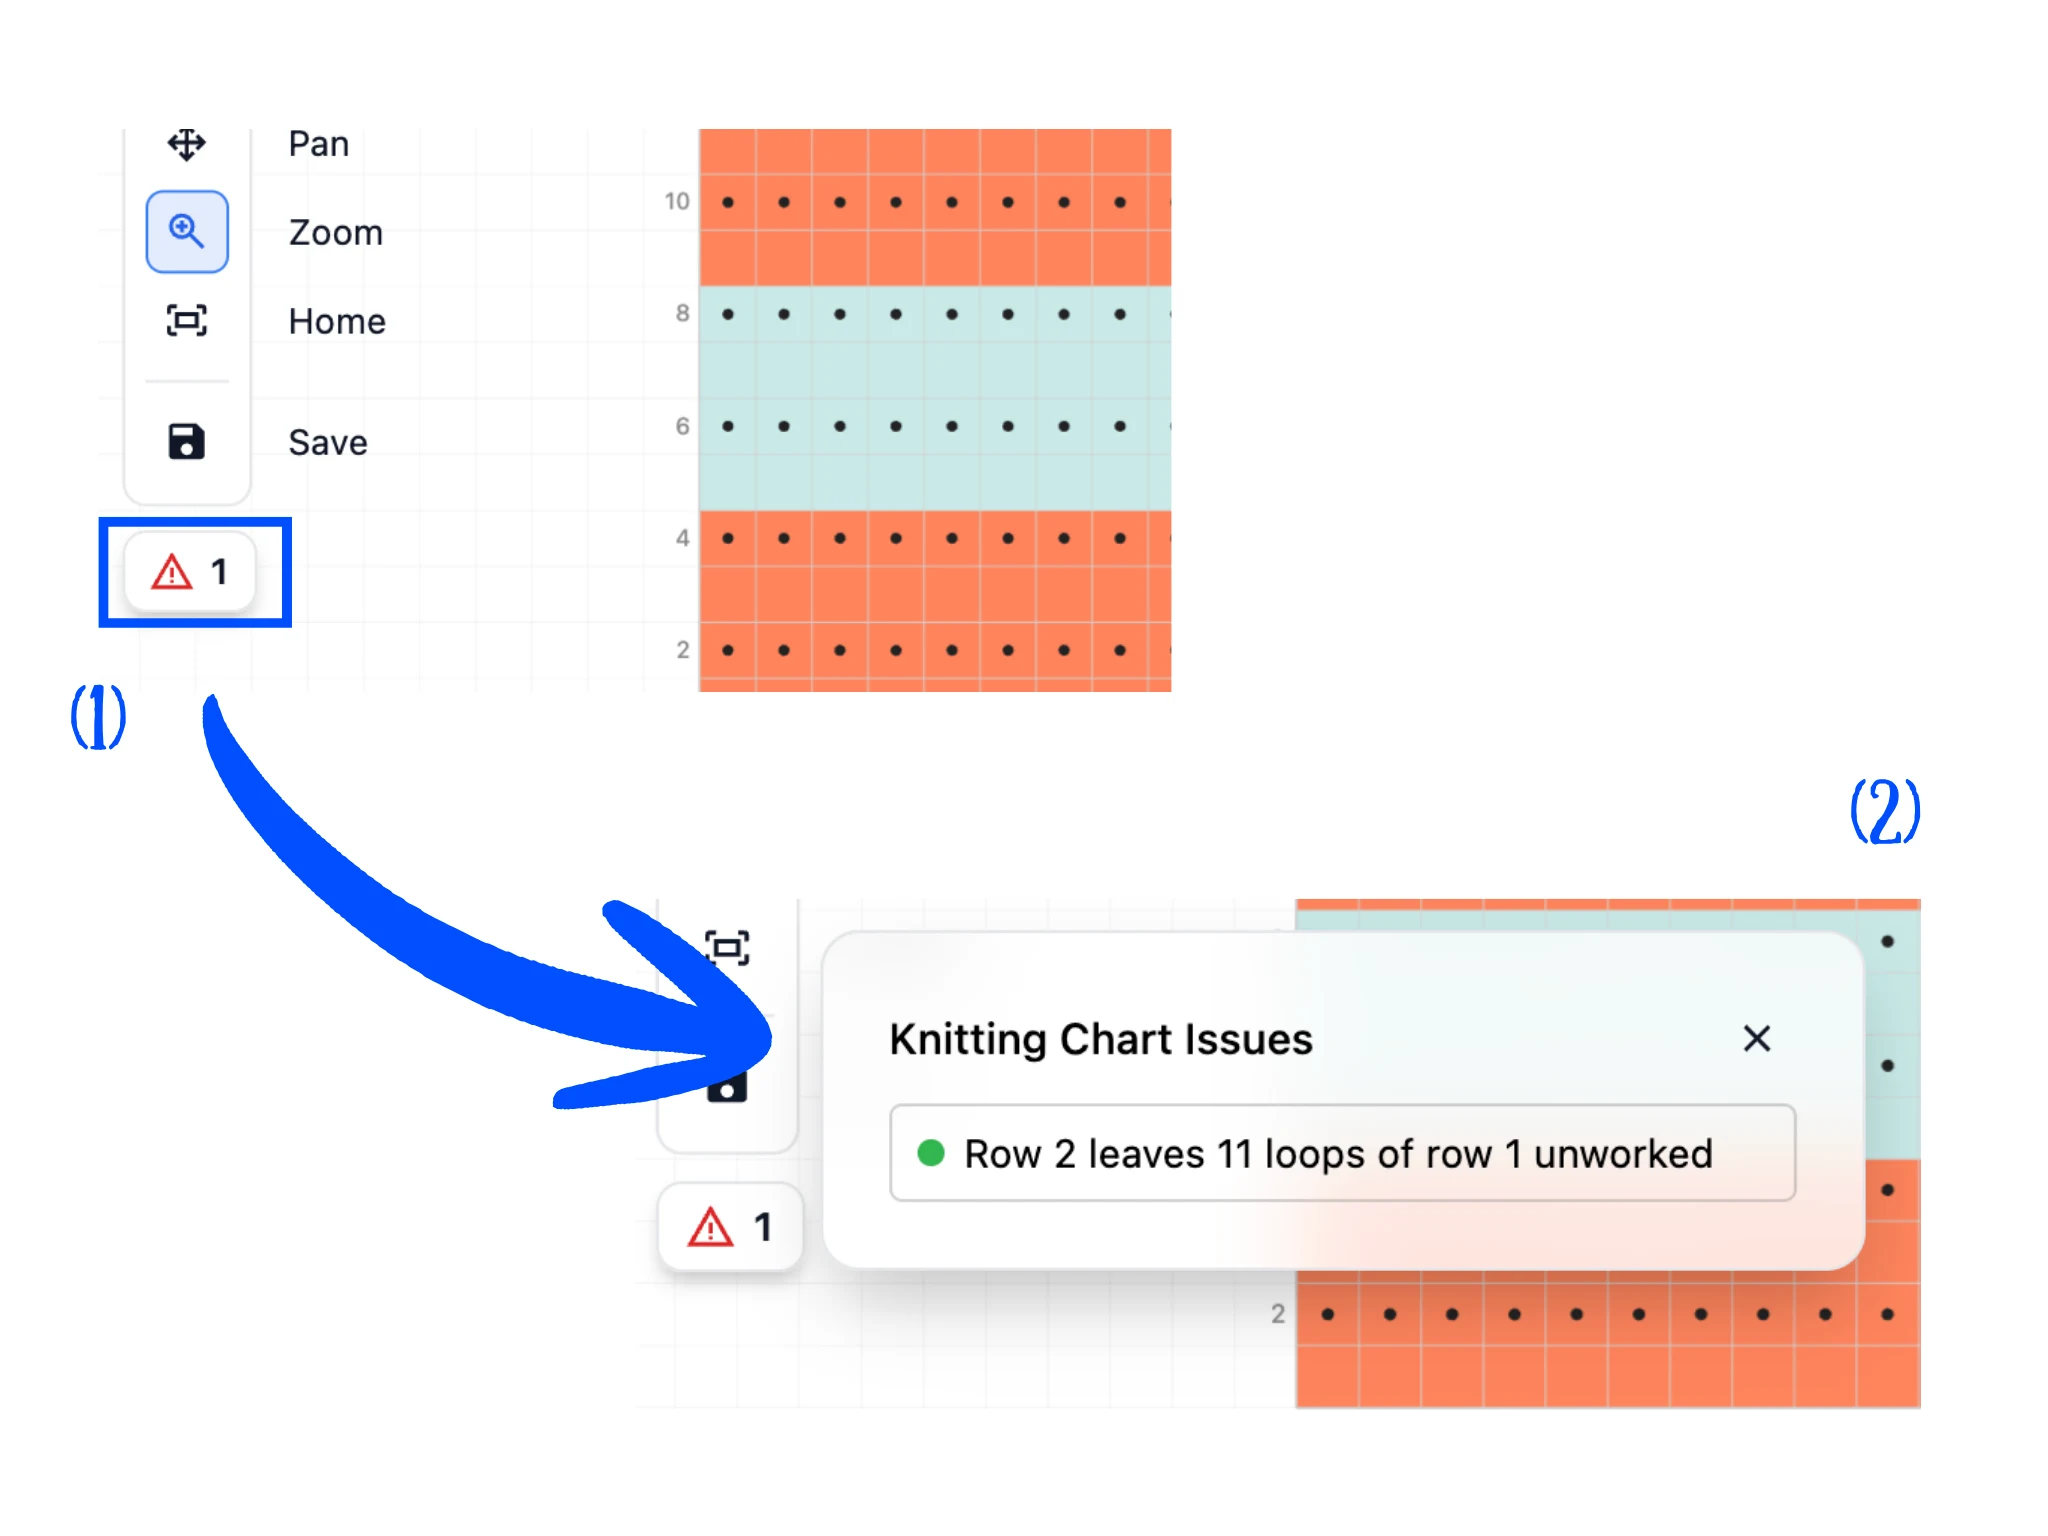
While you are charting, you may encounter many issues denoted by green and red "X"s. You may also encounter yellow "X"s that denote unique errors. All of these errors are described in detail in the Issues pop-up.
When you have errors, an icon with how many you have (1) will appear below the toolbar. Click on it to open a small window that describes exactly what each issue is in words.
Asunder Knit's automatic chart validation helps you catch errors before you begin knitting!
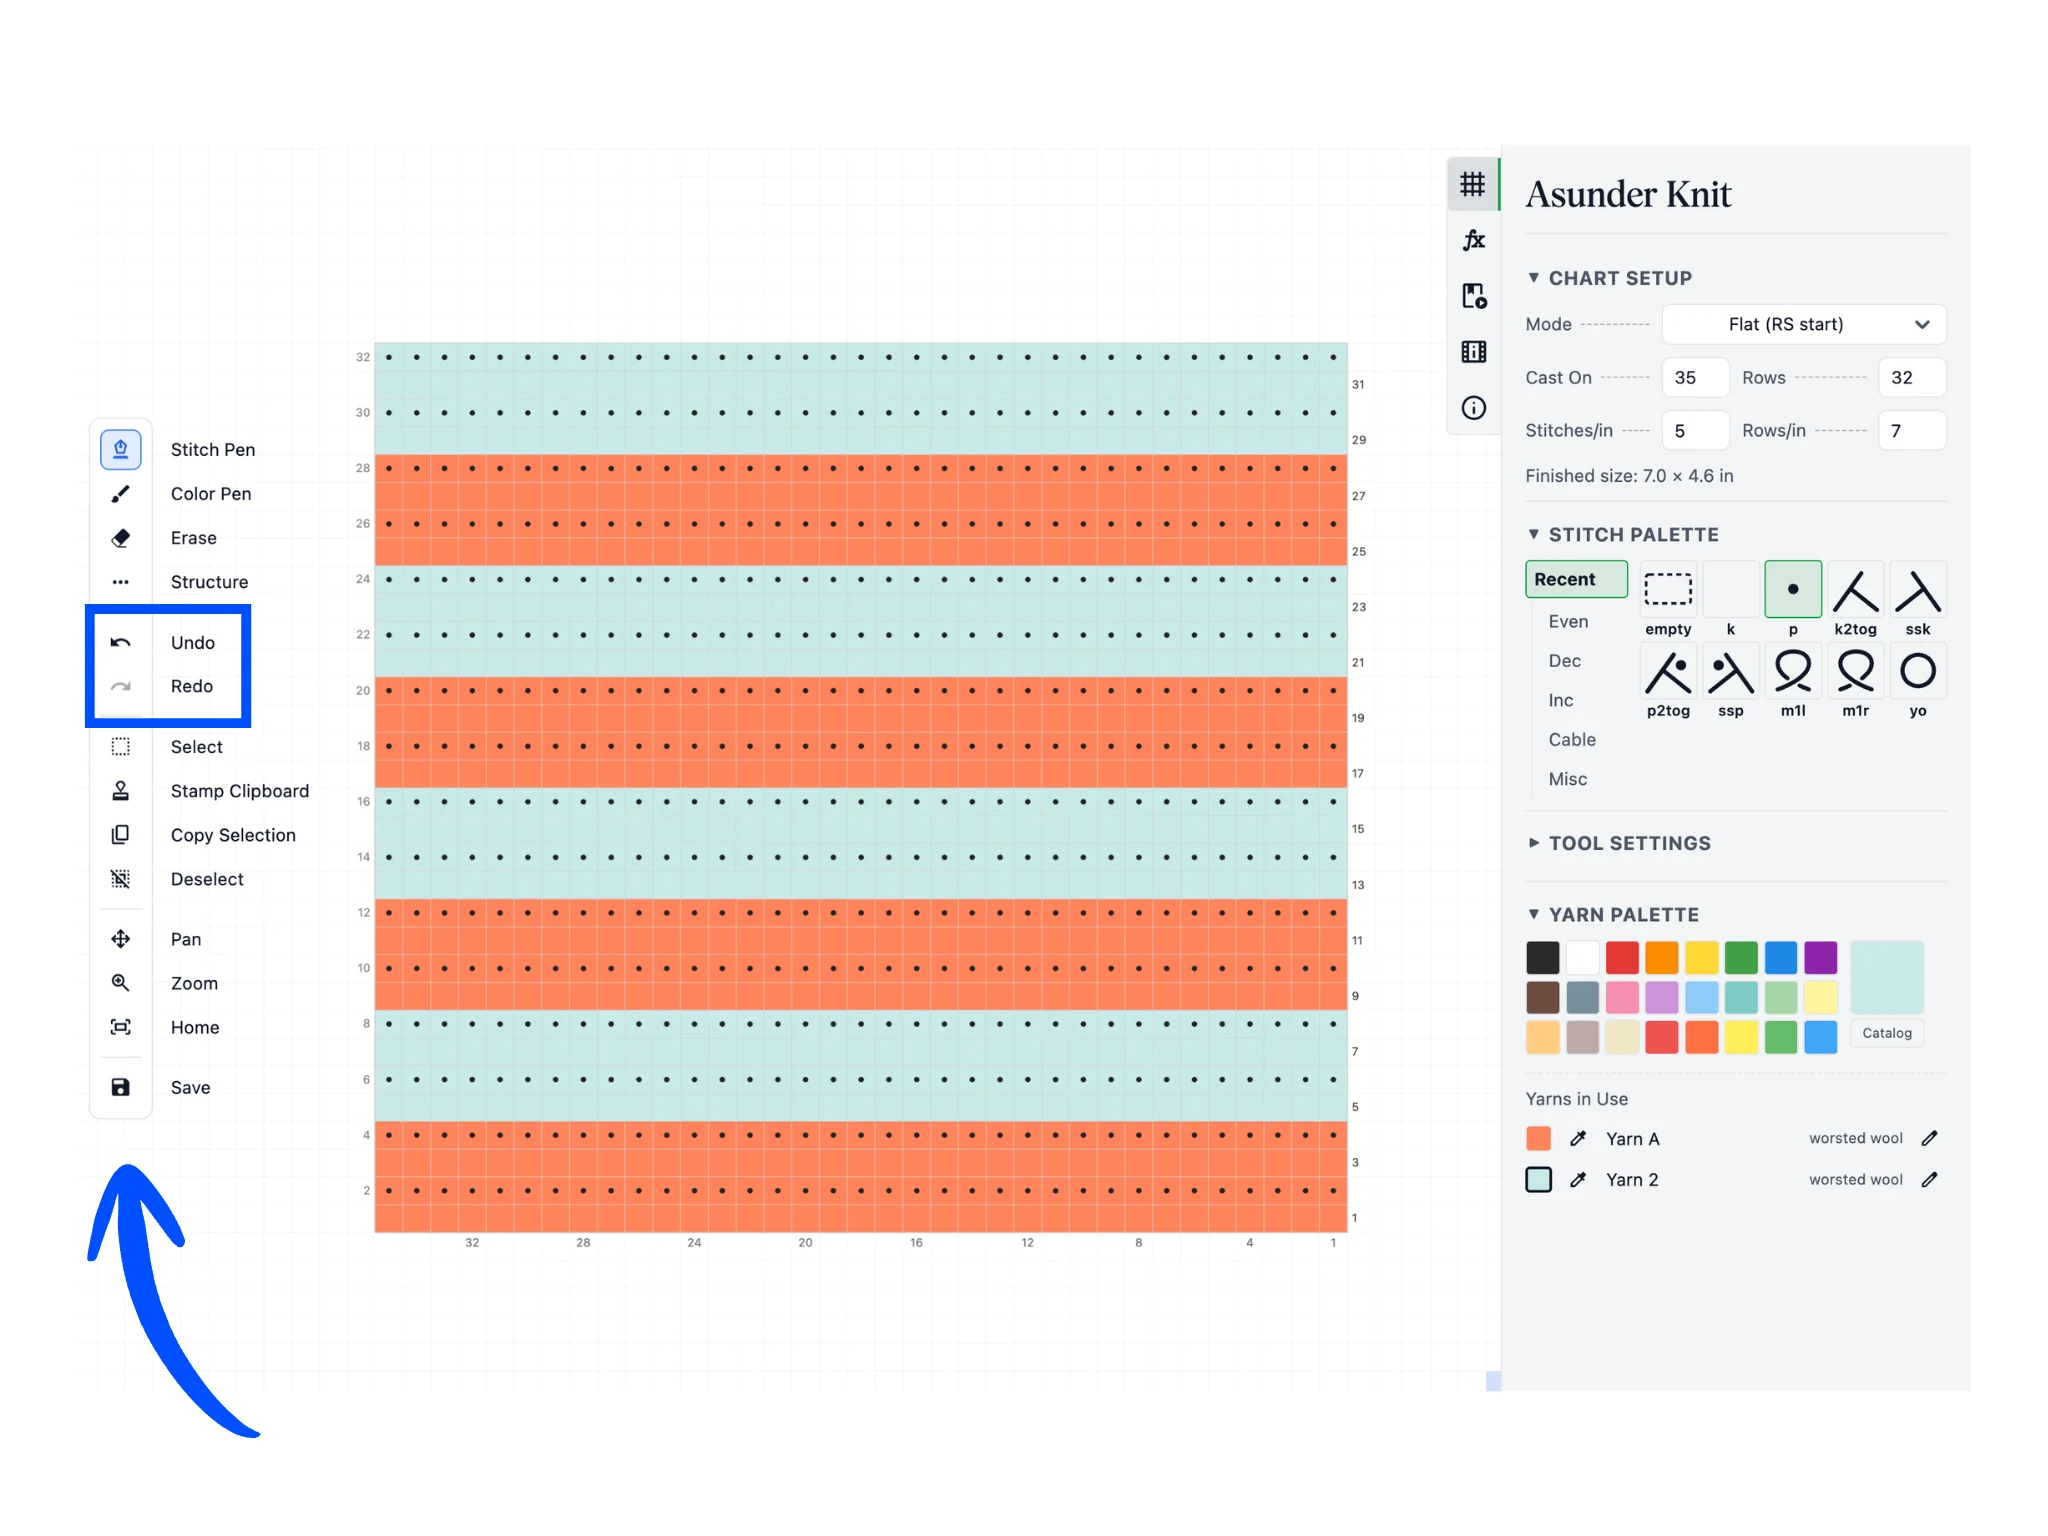
Now, use the skills you learned with the Stitch Pen and Color Pen to fill in the rest of the chart. Notice once we do so, there are no more errors!
Please notice there are also Undo and Redo buttons in the toolbar to help you as you work. You can use the keyboard shortcuts CTRL + Z to Undo and CTRL + SHIFT + Z to Redo. On Mac, please use CMD instead of CTRL.
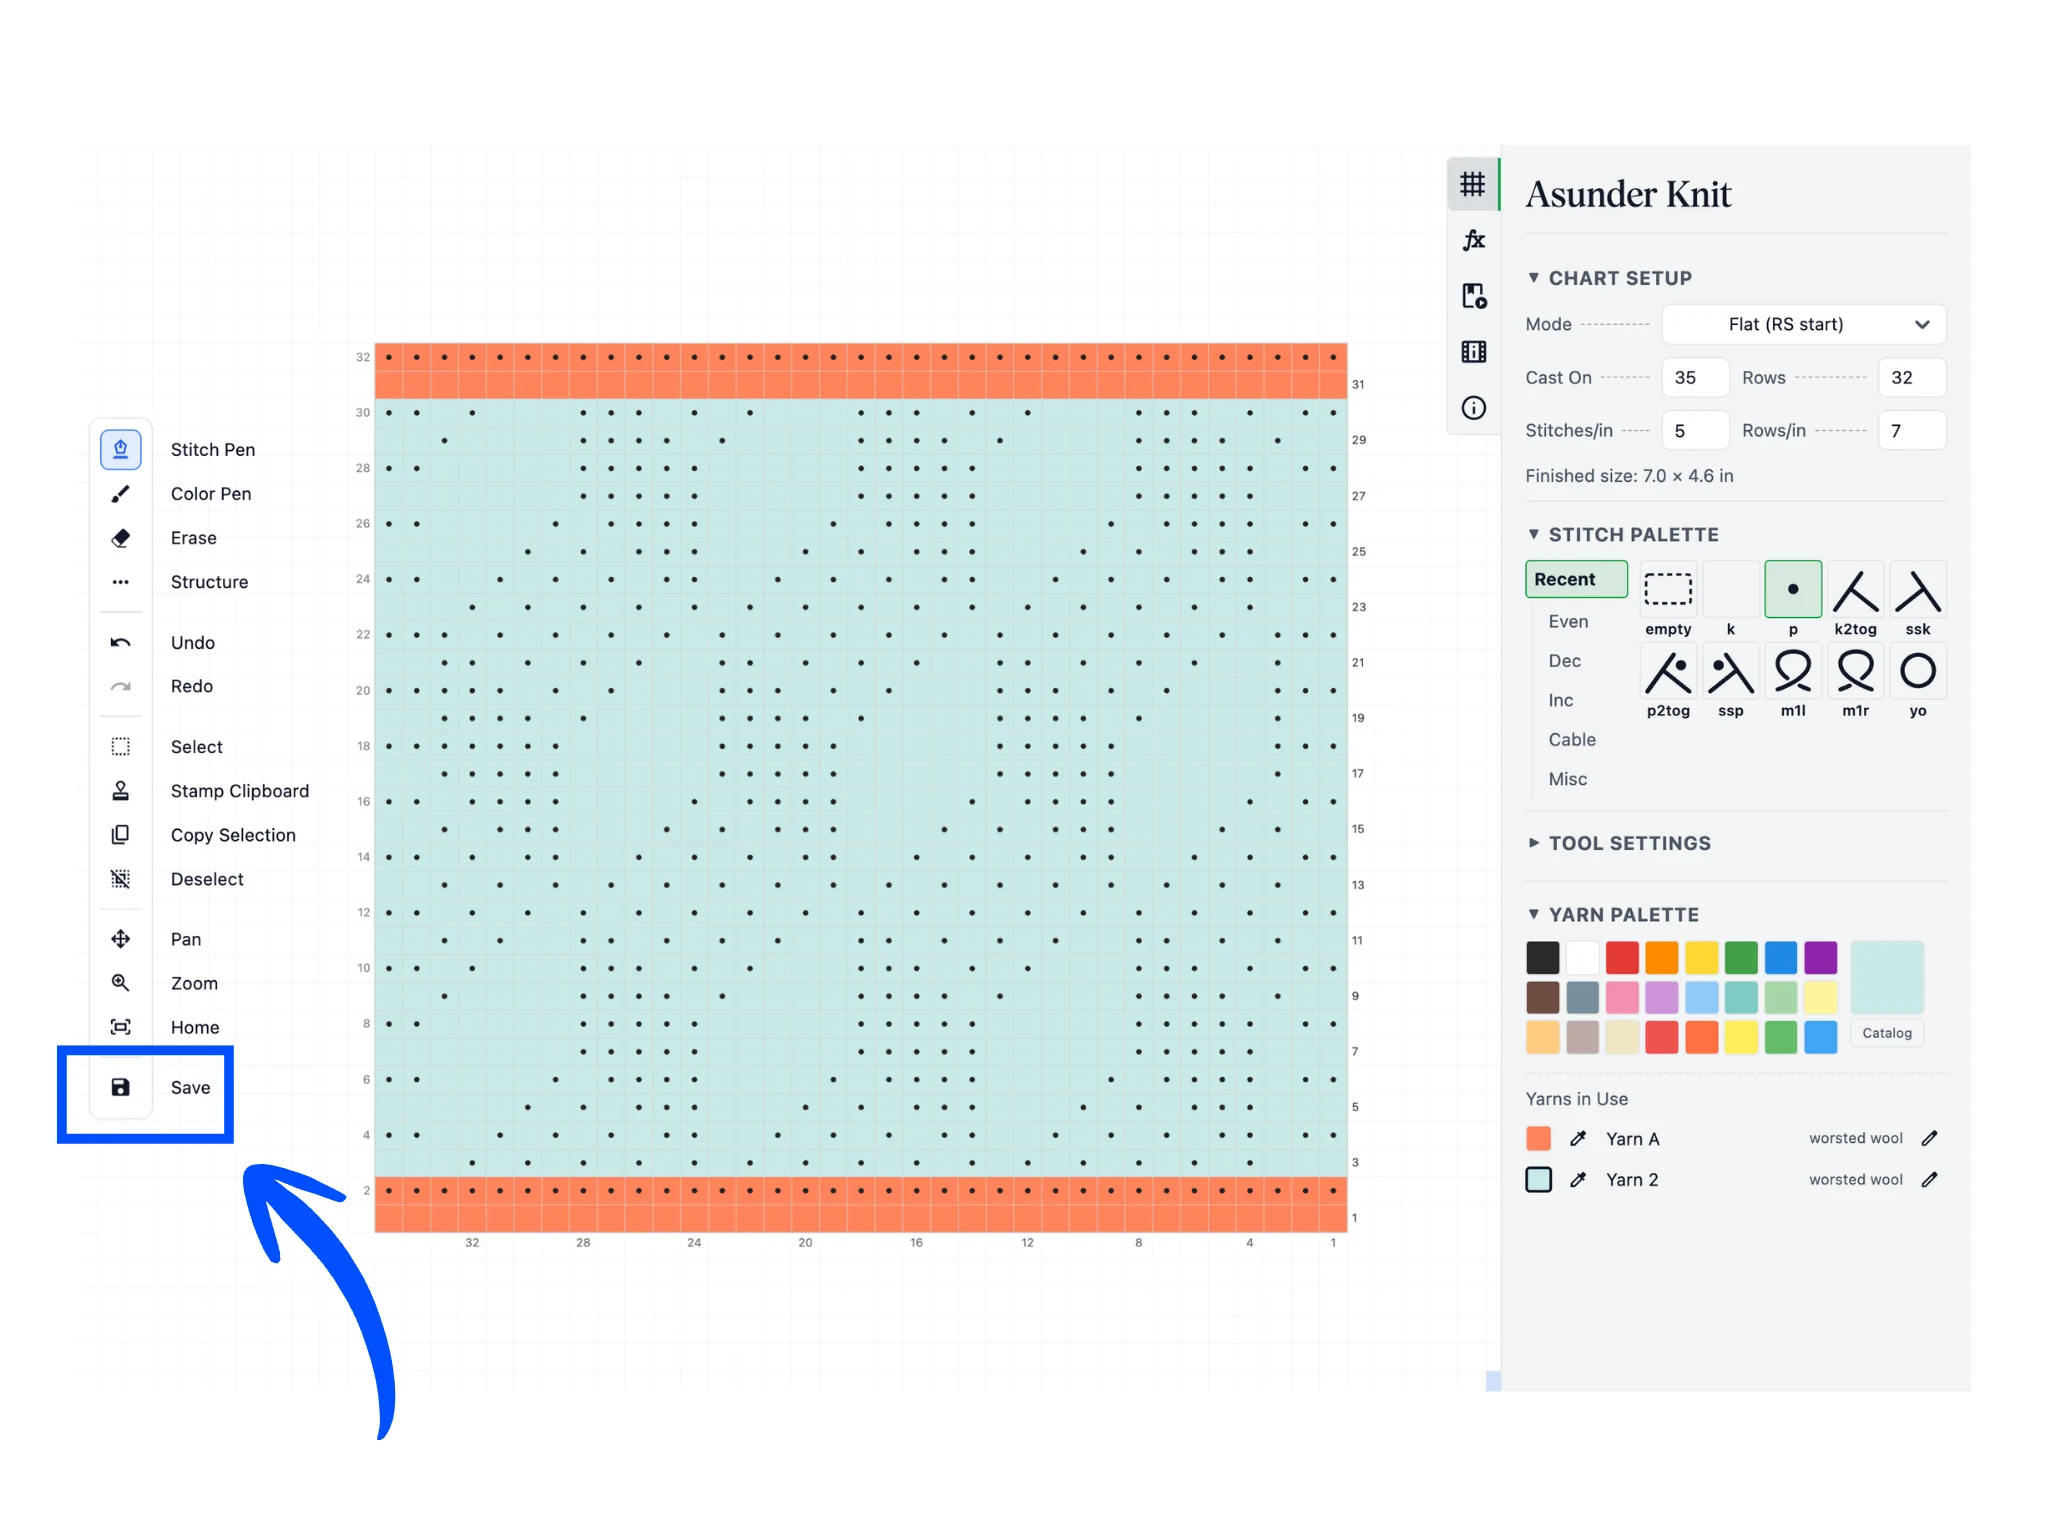
Here, I've changed the stitch to be tumbling blocks in the center and a garter border all around. I've also changed the striped colors to be a colored border instead. You know now everything you need to get started charting.
In the next few tutorials, you will learn more tools and operations in Asunder Knit to expedite your knitting design.
Before we finish, remember we need to save our project. In the toolbar at the bottom, click on the Save button.
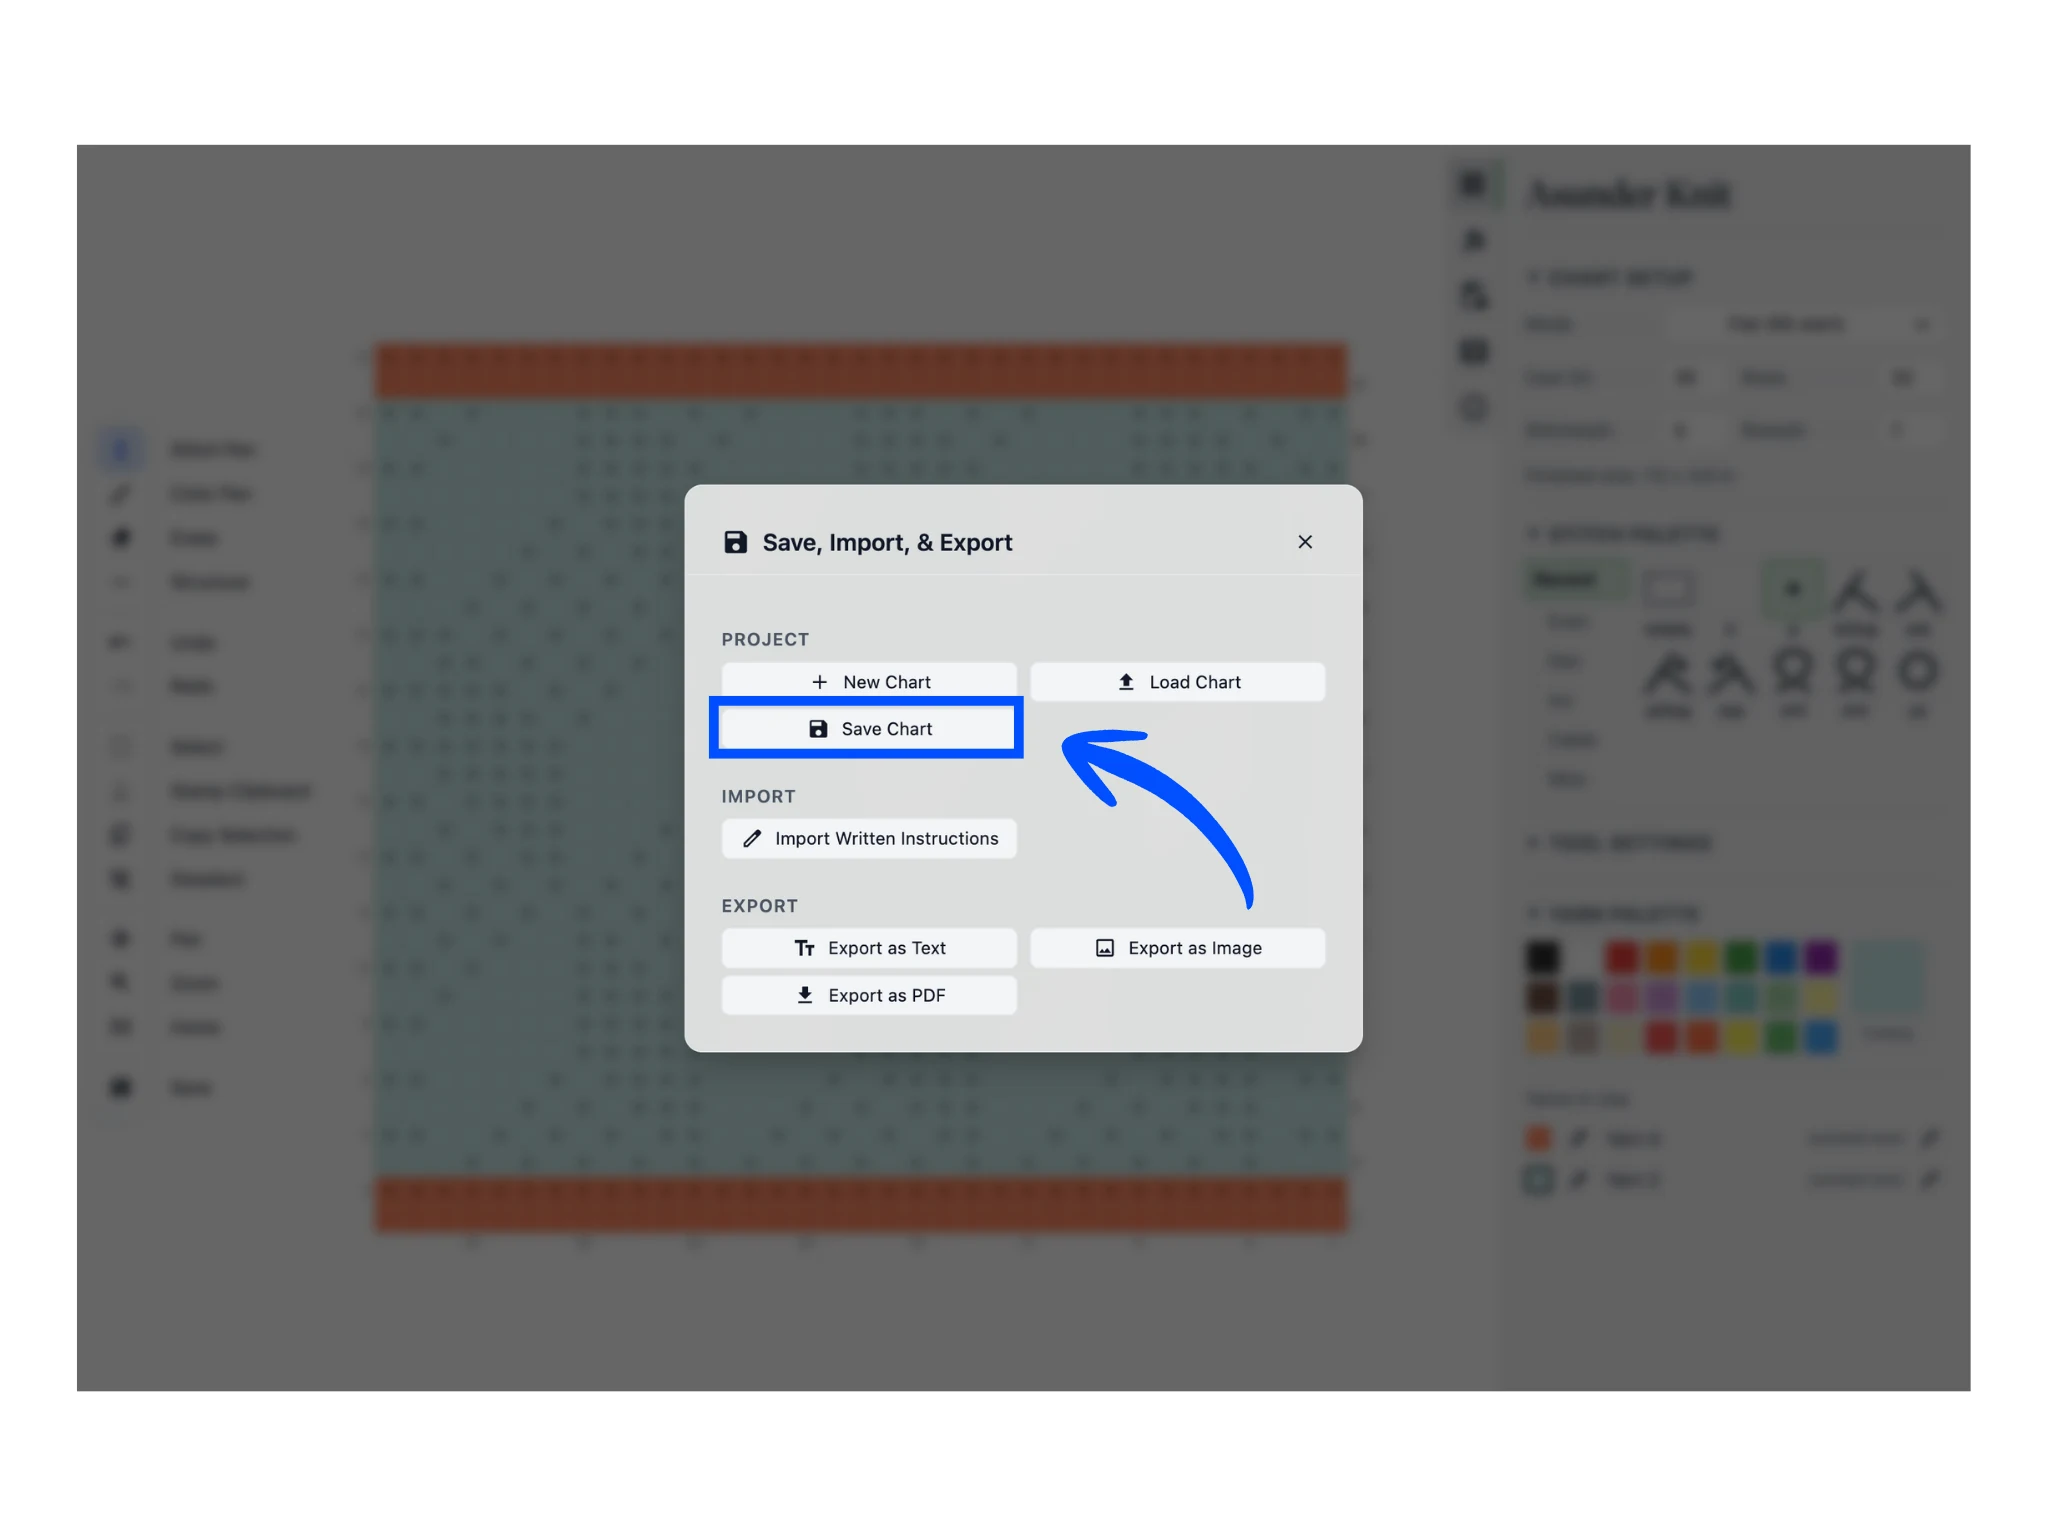
Click on the "Save Chart" button which will download a .KNIT file to your computer. This is the file format that all projects from Asunder Knit are saved in. You will be able to load these projects back into Asunder Knit using the "Load Chart" button.
You can also export PNG, PDF, and TEXT files from Asunder Knit. They download your project in the respective file formats to your computer.
Congratulations on finishing your first tutorial using Asunder Knit! You have embarked on an amazing knitting software journey :)