MonteGrid | Tutorials | Review the results
Review the results
Read the forecasts and the sensitivity charts, calculate a probability from the trial data, and create a report.
-
1Open the Results page
The figures are from the 10,000-trial run in Set up run settings. To start here, download the workbook below and run it with 10,000 trials.
-
2Panels
Panel Content Export Create Report and Extract Data. Forecasts Each forecast with its P50. Click a forecast to show it. Distribution Histogram of the forecast, with the P10–P90 range shaded. Statistics P10, P50, P90, mean, SD and P80. Tornado Change in the forecast as each assumption moves alone across its range. Rank correlation (Spearman) Rank correlation of each assumption with the forecast, over all trials. About this run Notes on the run, when there are any. Details shows them in full. 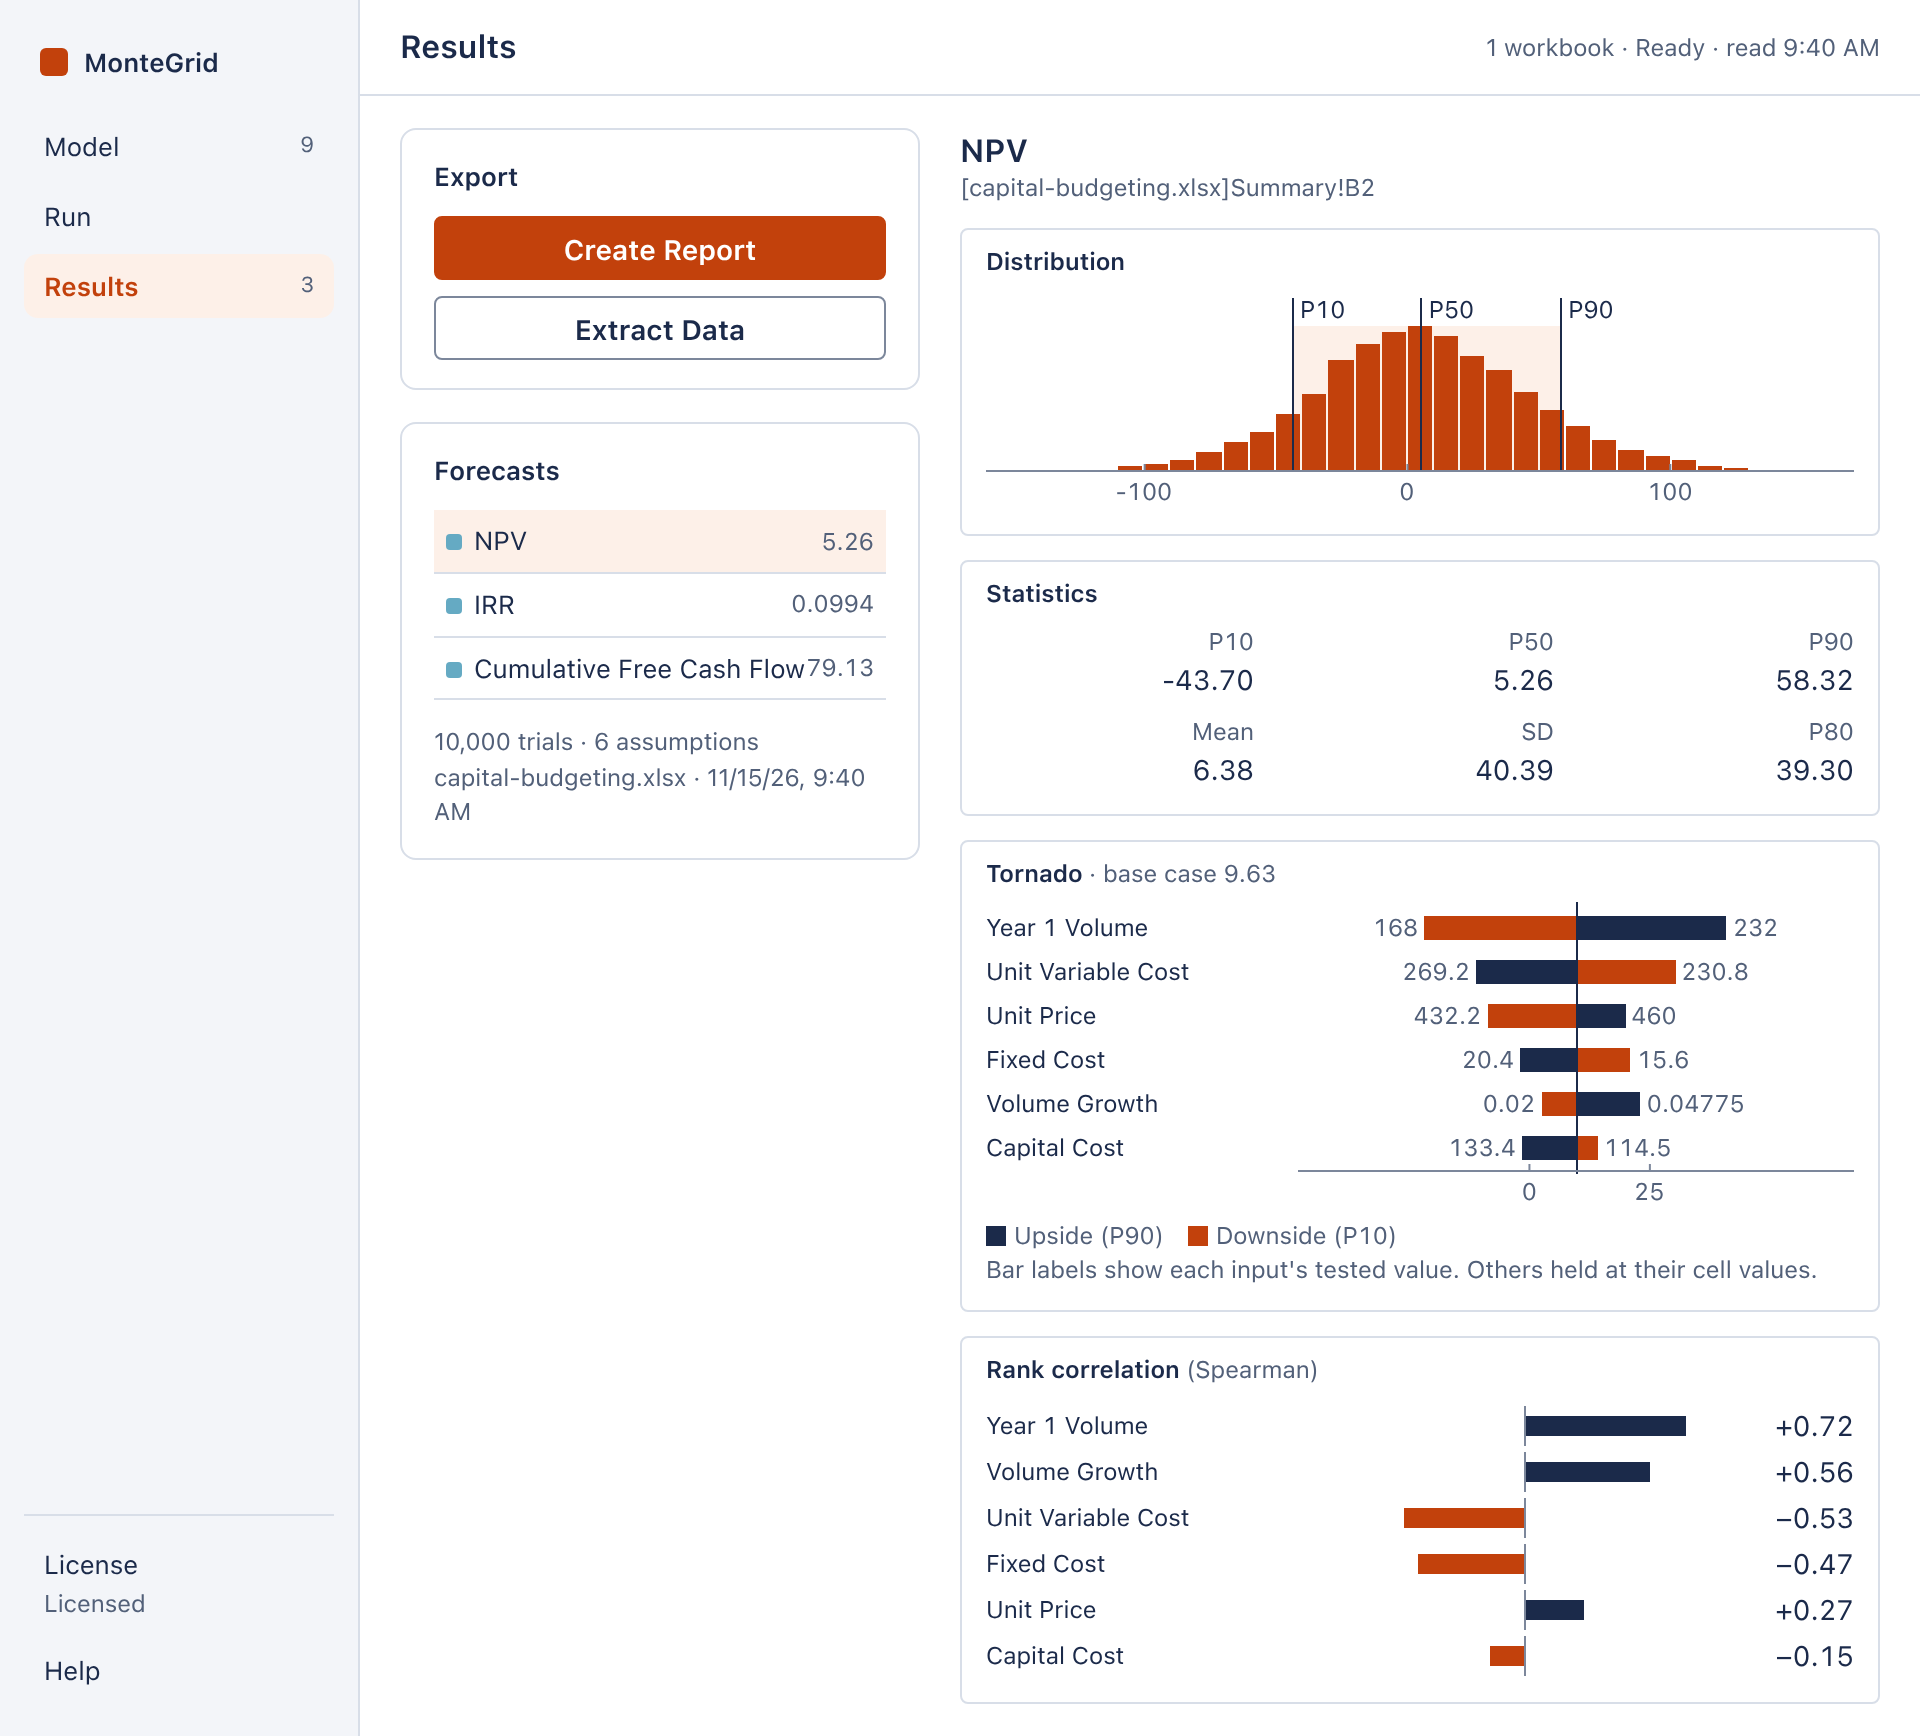
The Results page. Open full size -
3Statistics
Percentiles interpolate between trials as Excel's PERCENTILE.INC does. SD is the sample standard deviation.
A trial in which a forecast is not a number is excluded from that forecast's statistics, and the Distribution panel states the count. Click IRR: it is #NUM! in 9 of the 10,000 trials.
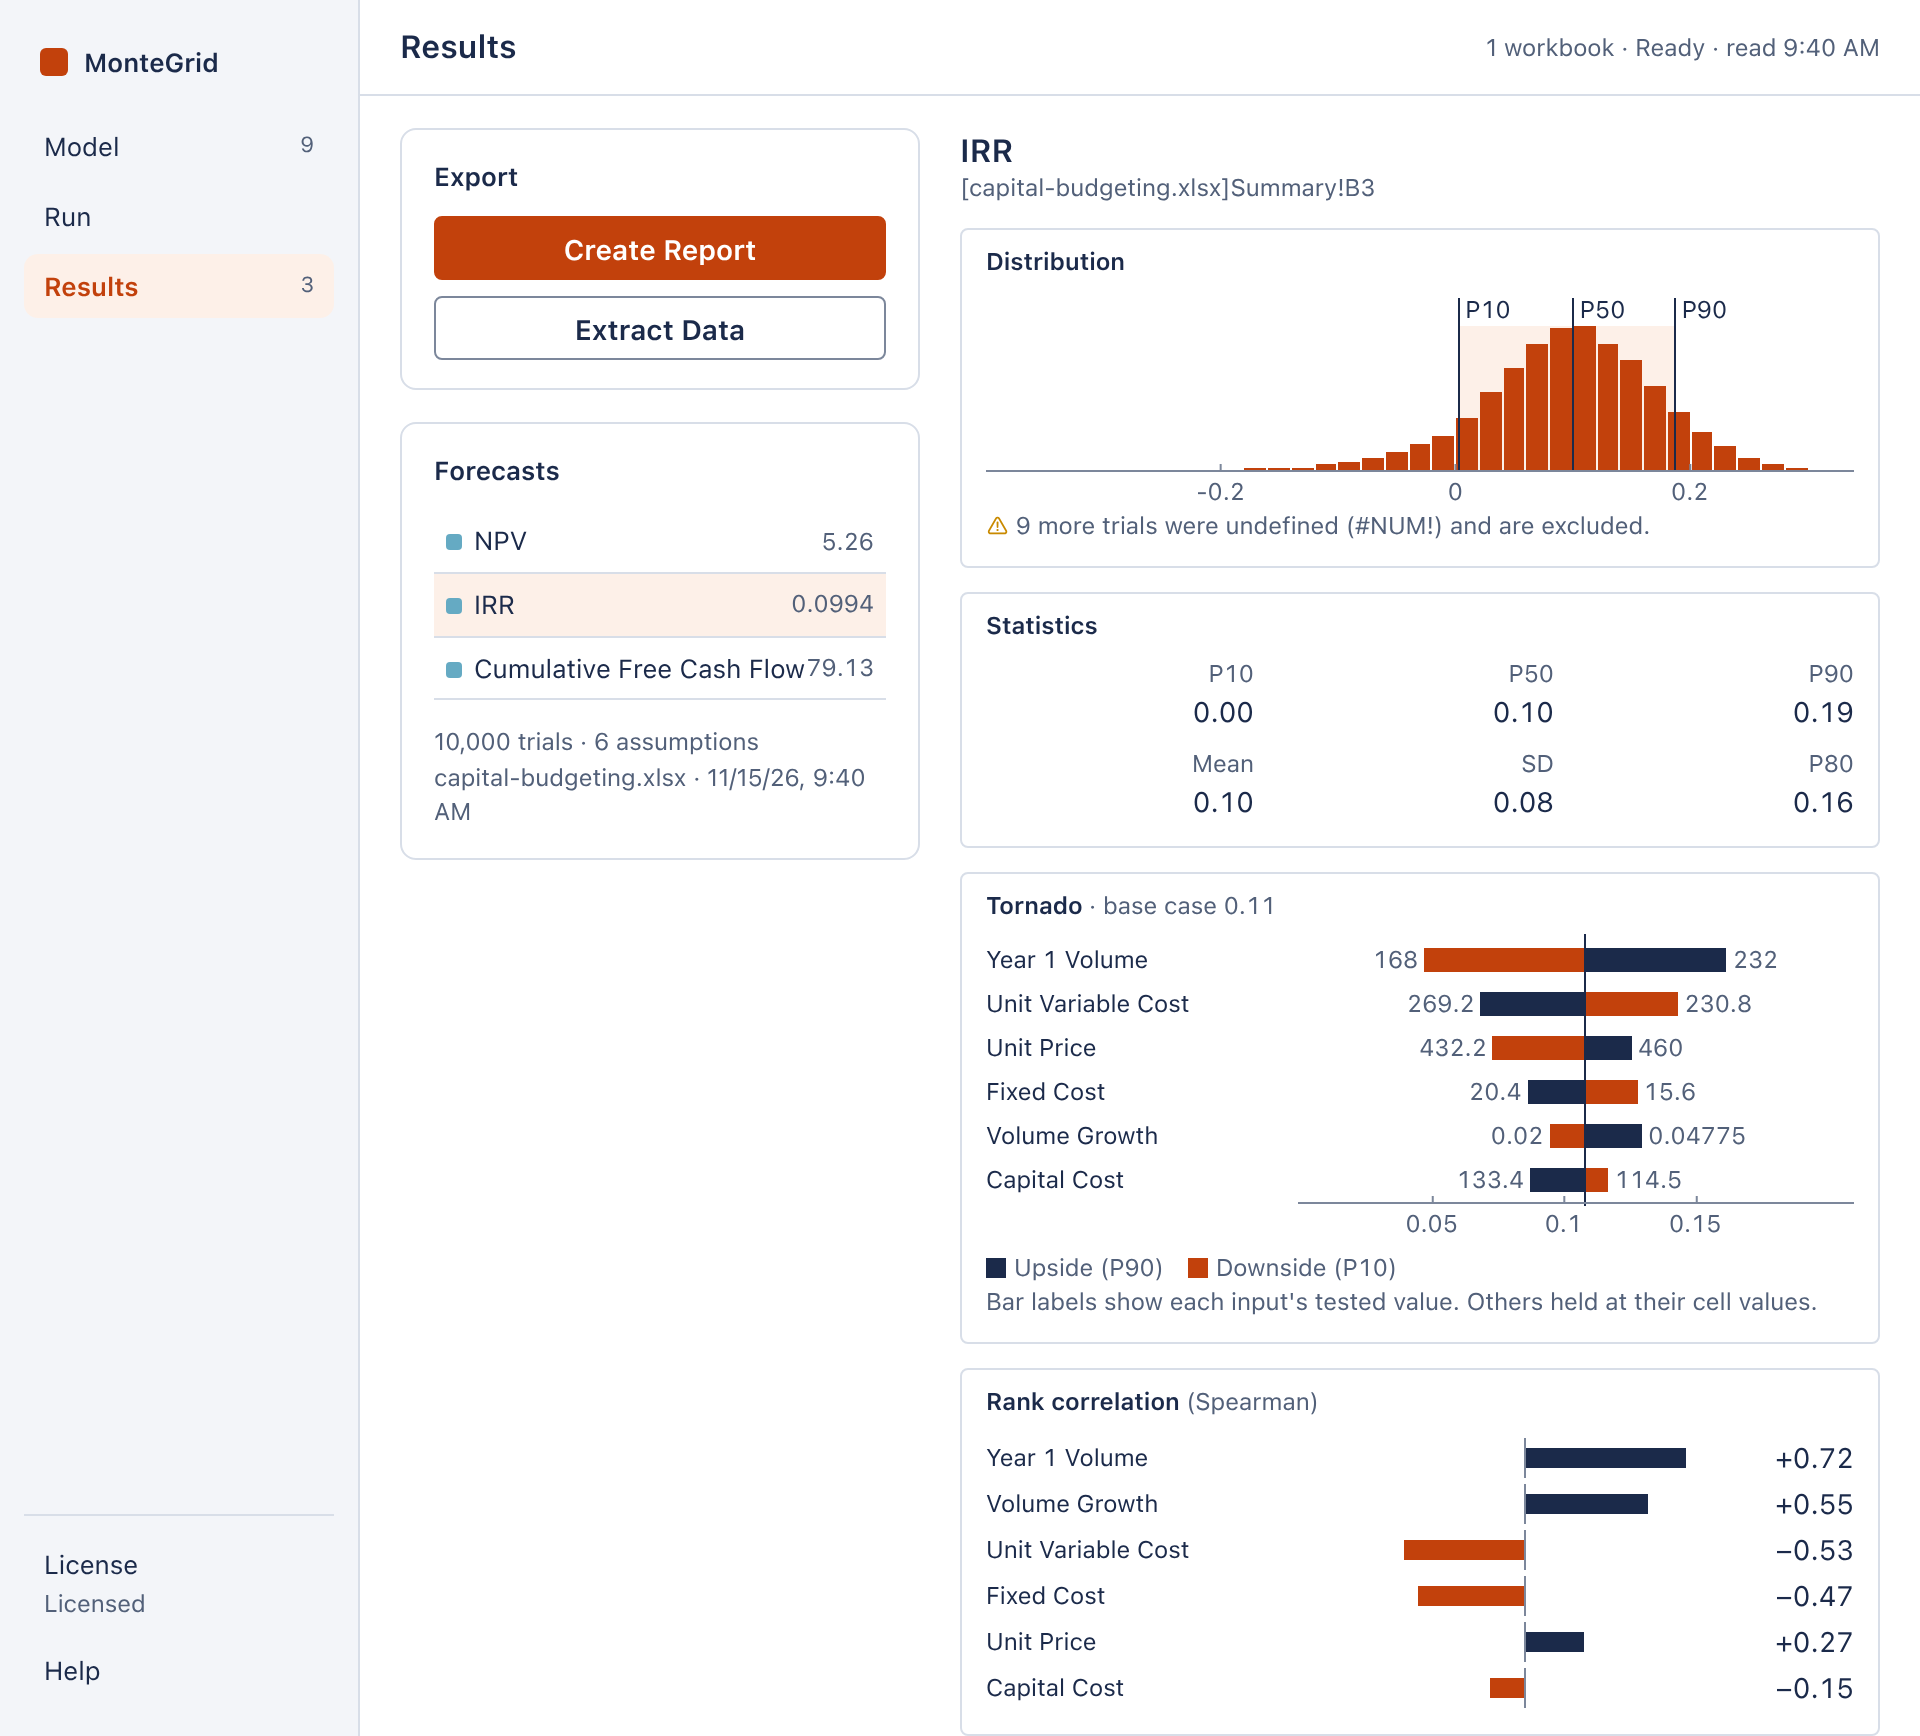
IRR, with 9 undefined trials. Open full size -
4Tornado chart
MonteGrid tests each assumption at its 10th, 30th, 50th, 70th and 90th percentiles, with all other assumptions at their cell values. A bar spans the resulting range of the forecast, and its labels are the tested values of the assumption. Up to ten bars are shown, widest first. These are the method and default test points of Crystal Ball's tornado chart.
An asterisk marks a bar that is not monotonic: the extreme of the forecast lies inside the tested range.
-
5Rank correlation
The Spearman rank correlation between the sampled values of each assumption and the forecast, over all trials. Unlike the tornado chart, it includes the correlations between assumptions: Volume Growth ranks second here and fifth in the tornado chart. At most eight assumptions are shown, and none below 0.05 in magnitude.
Click an assumption to plot its trials against the forecast.
-
6Probability of a negative NPV
The Results page has no certainty range. To calculate a probability, extract the trials:
- Click Extract Data. MonteGrid writes a workbook named MC Data followed by the date and time, and opens it in Excel.
- In an empty cell, enter =COUNTIF(H:H,"<0")/COUNT(H:H), with H the NPV column.
The result is 44.5%, against a positive base case NPV of $9.6M.
MC Data has one row per trial: the trial number, the sampled value of each assumption and the value of each forecast. A forecast value that is not a number is blank.
-
7Report
Click Create Report. MonteGrid writes a workbook named MC Report followed by the date and time, in the layout of a Crystal Ball report: run preferences and statistics; for each forecast, a chart, statistics and percentiles; the tornado and sensitivity tables and charts; and the parameters of each assumption.
Note: MonteGrid writes both workbooks to Excel's own folder. When it writes a new one, it deletes its earlier ones that are more than seven days old. Save a copy elsewhere to keep it.