MonteGrid | Tutorials | Build a model and run a first simulation
Build a model and run a first simulation
Define the assumptions and forecasts of a capital budgeting model and run a simulation. The next four tutorials continue with this model.
-
1Open the model
The model is a 10-year cash flow for a new plant. The inputs are on the Inputs sheet. NPV, IRR and cumulative free cash flow are on the Summary sheet. The base case NPV is $9.6M.
Download the workbook below and open it in Excel. To install MonteGrid, see Install MonteGrid on Mac.
HomeInsertDrawPage LayoutFormulasDataReviewViewAutomateMonteGrid


 A1 Input
A B C D E F G H I J K L M 1 Input Value Unit 2 Capital cost 120.0 $M 3 Year 1 volume 200.0 thousand units 4 Volume growth per year 3.0% % 5 Unit price, year 1 450.0 $ 6 Price change per year -1.0% % 7 Variable cost per unit 250.0 $ 8 Fixed cost per year 18.0 $M 9 Tax rate 25.0% % 10 Discount rate 9.0% % 11 Plant life 10 years 12 13 14 15 16 17 18 19 20 21 22 23 24 25 26 27 28 29 30 31 32 AboutInputsCash FlowSummaryReadyAccessibility: Good to goThe model in Excel. HomeInsertDrawPage LayoutFormulasDataReviewViewAutomateMonteGrid A1 InputA B C D E F 1 Input Value Unit 2 Capital cost 120.0 $M 3 Year 1 volume 200.0 thousand units 4 Volume growth per year 3.0% % 5 Unit price, year 1 450.0 $ 6 Price change per year -1.0% % 7 Variable cost per unit 250.0 $ 8 Fixed cost per year 18.0 $M 9 Tax rate 25.0% % 10 Discount rate 9.0% % 11 Plant life 10 years 12 13 14 15 16 17 18 AboutInputsCash FlowSummaryReadyAccessibility: Good to go -
2Define the unit price
The unit price is between 420 and 470, most likely 450.
To define the assumption:
- Select Inputs!B5.
- On the MonteGrid tab, click Define Assumption. The distribution list opens.
- In the Common group, click Triangular, then click Use Triangular.
- Enter 420 in Minimum, 450 in Most likely and 470 in Maximum.
- Enter Unit Price in Name.
- Click Save assumption.
MonteGrid writes =MC_TRIANG(420,450,470,MC_STATIC(450,"Unit Price","")) into the cell. Outside a simulation, the cell returns its static value, 450.
HomeInsertDrawPage LayoutFormulasDataReviewViewAutomateMonteGrid B5 450A B C D E F G H I J K L M 1 Input Value Unit 2 Capital cost 120.0 $M 3 Year 1 volume 200.0 thousand units 4 Volume growth per year 3.0% % 5 Unit price, year 1 450.0 $ 6 Price change per year -1.0% % 7 Variable cost per unit 250.0 $ 8 Fixed cost per year 18.0 $M 9 Tax rate 25.0% % 10 Discount rate 9.0% % 11 Plant life 10 years 12 13 14 15 16 17 18 19 20 21 22 23 24 25 26 27 28 29 30 31 32 AboutInputsCash FlowSummaryReadyAccessibility: Good to goDefine Assumption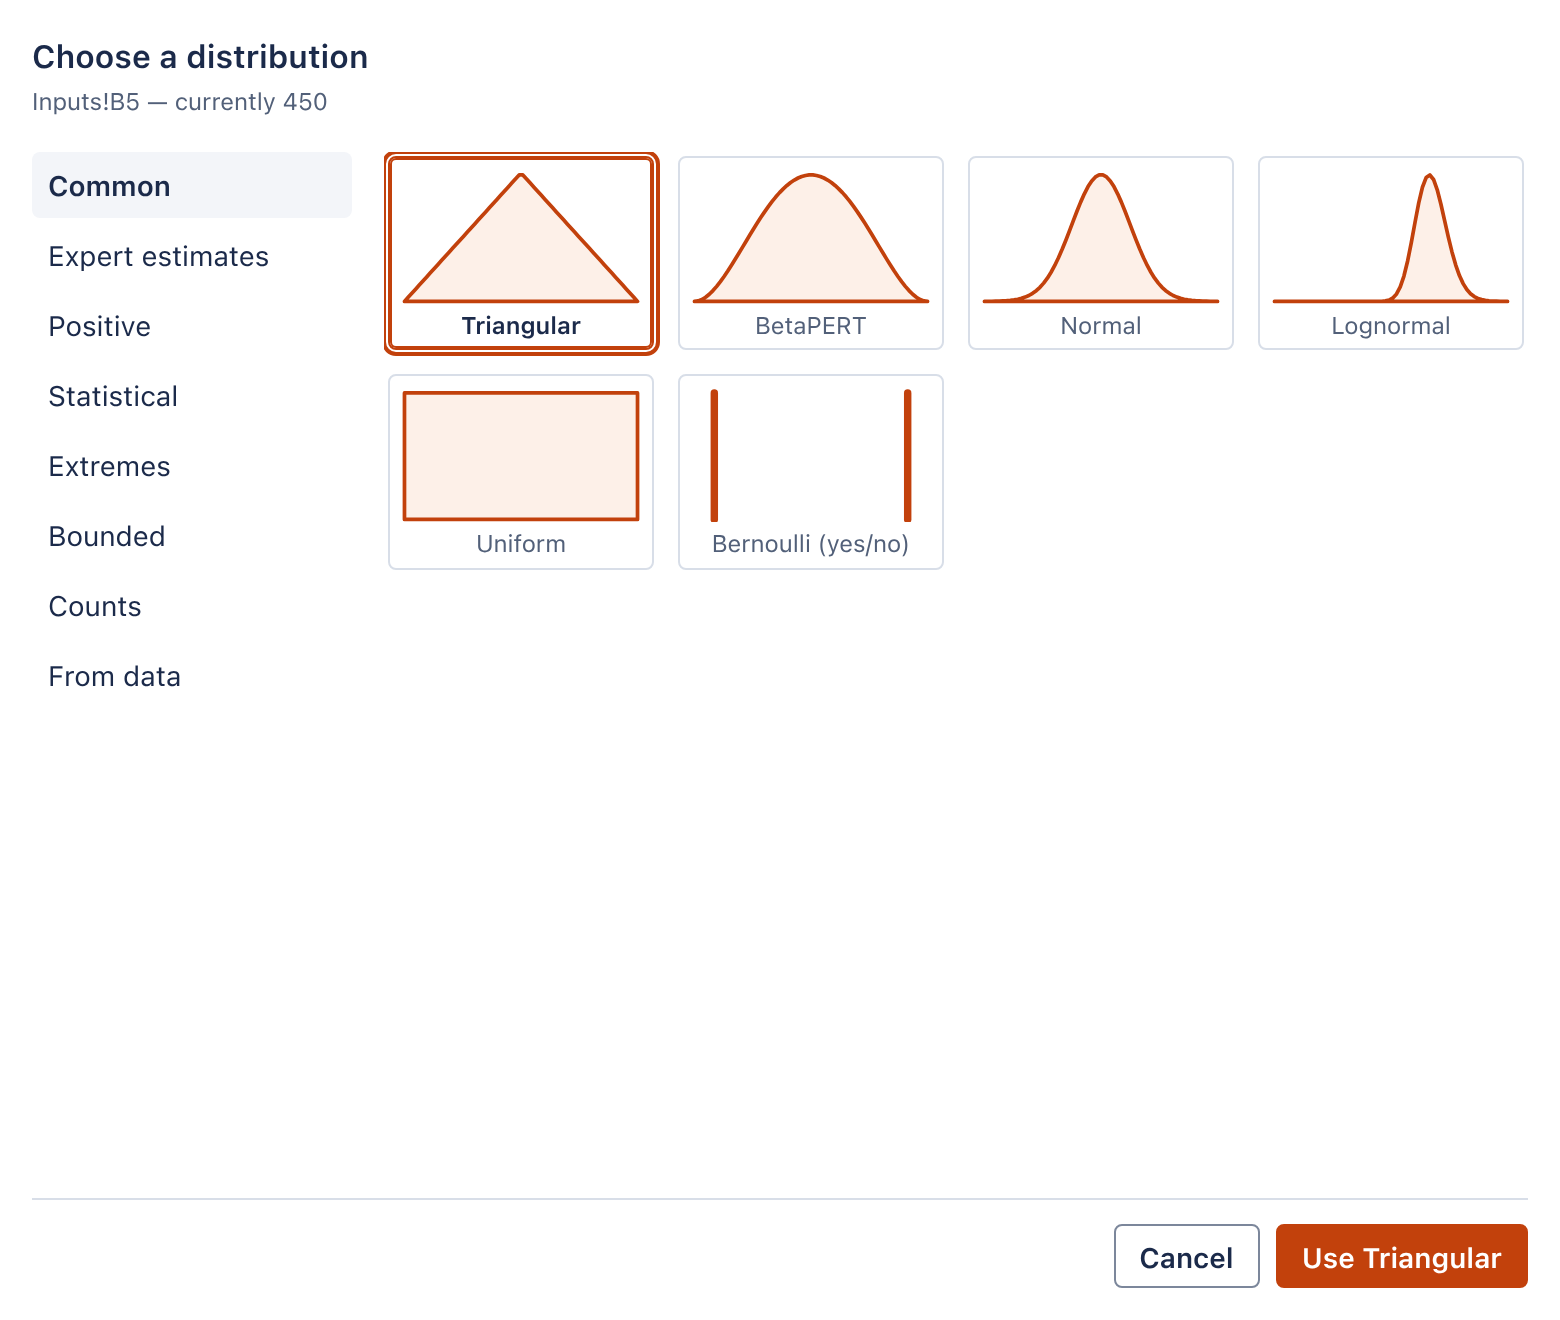
The distribution list. The distribution list. Open full size 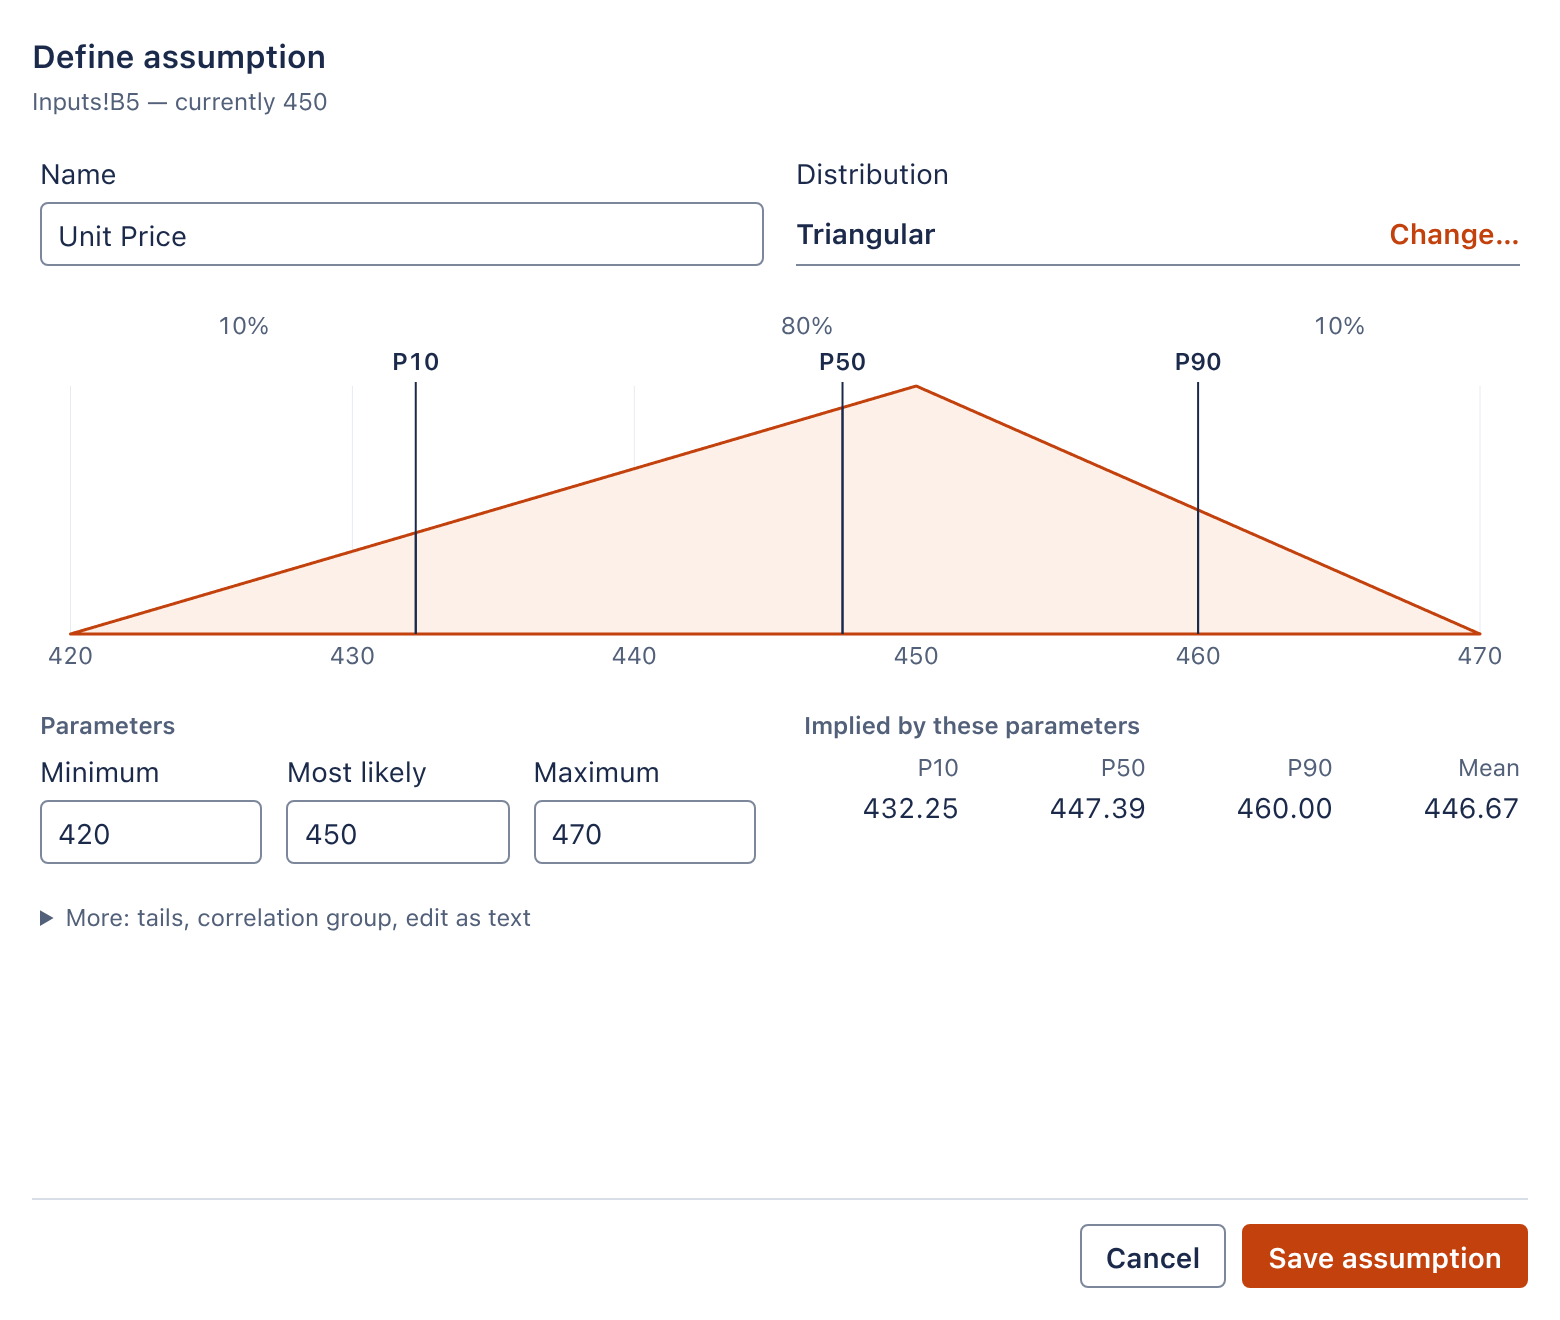
Unit Price, Triangular. Open full size -
3Define the other assumptions
Define the other five inputs the same way. All five distributions are in the Common group.
Cell Input Name Distribution Parameters B2 Capital cost ($M) Capital Cost BetaPERT Minimum 110, most likely 120, maximum 150 B3 Year 1 volume (thousand units) Year 1 Volume Normal Mean 200, standard deviation 25 B4 Volume growth per year Volume Growth Triangular Minimum 0.01, most likely 0.03, maximum 0.06 B7 Variable cost per unit ($) Unit Variable Cost Normal Mean 250, standard deviation 15 B8 Fixed cost per year ($M) Fixed Cost Uniform Minimum 15, maximum 21 Note: Define Assumption has 42 distributions in eight groups. Under More: tails, correlation group, edit as text, you can truncate the distribution, set a correlation group, or type the parameters, for example min=110, likely=120, max=150.
HomeInsertDrawPage LayoutFormulasDataReviewViewAutomateMonteGrid B8 =MC_UNIFORM(15,21,MC_STATIC(18,"Fixed Cost",""))A B C D E F G H I J K L M 1 Input Value Unit 2 Capital cost 120.0 $M 3 Year 1 volume 200.0 thousand units 4 Volume growth per year 3.0% % 5 Unit price, year 1 450.0 $ 6 Price change per year -1.0% % 7 Variable cost per unit 250.0 $ 8 Fixed cost per year 18.0 $M 9 Tax rate 25.0% % 10 Discount rate 9.0% % 11 Plant life 10 years 12 13 14 15 16 17 18 19 20 21 22 23 24 25 26 27 28 29 30 31 32 AboutInputsCash FlowSummaryReadyAccessibility: Good to goSix assumptions. HomeInsertDrawPage LayoutFormulasDataReviewViewAutomateMonteGrid B8 =MC_UNIFORM(15,21,MC_STATIC(18,"Fixed Cost",""))A B C D E F 1 Input Value Unit 2 Capital cost 120.0 $M 3 Year 1 volume 200.0 thousand units 4 Volume growth per year 3.0% % 5 Unit price, year 1 450.0 $ 6 Price change per year -1.0% % 7 Variable cost per unit 250.0 $ 8 Fixed cost per year 18.0 $M 9 Tax rate 25.0% % 10 Discount rate 9.0% % 11 Plant life 10 years 12 13 14 15 16 17 18 AboutInputsCash FlowSummaryReadyAccessibility: Good to go -
4Define the forecasts
To define the NPV forecast:
- Select Summary!B2.
- On the MonteGrid tab, click Define Forecast.
- Enter NPV in Name.
- Click Save forecast.
Define Summary!B3 as IRR and Summary!B4 as Cumulative Free Cash Flow the same way. MonteGrid wraps each formula in MC_OUTPUT, for example =MC_OUTPUT(SUM('Cash Flow'!B14:L14),"NPV").
Note: Clear Definition removes a definition. An assumption returns to its static value, a forecast to its formula.
HomeInsertDrawPage LayoutFormulasDataReviewViewAutomateMonteGrid B2 =SUM('Cash Flow'!B14:L14)A B C D E F G H I J K L M 1 Measure Value Unit 2 Net present value 9.6 $M 3 Internal rate of return 10.8% % 4 Cumulative free cash flow 83.2 $M 5 6 7 8 9 10 11 12 13 14 15 16 17 18 19 20 21 22 23 24 25 26 27 28 29 30 31 32 AboutInputsCash FlowSummaryReadyAccessibility: Good to goDefine Forecast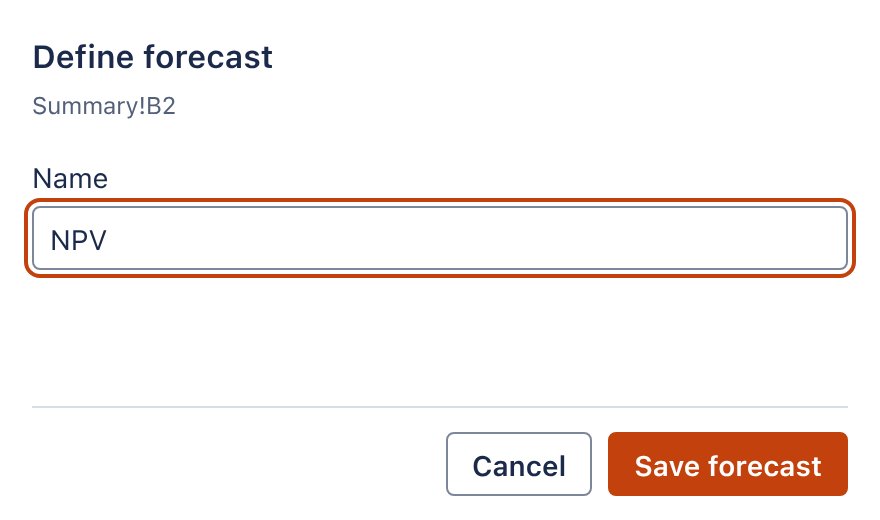
Define Forecast. Define Forecast. Open full size -
5Run the simulation
To run the simulation:
- On the MonteGrid tab, click Open MonteGrid. The Model page lists six assumptions and three forecasts.
- In the sidebar, click Run.
- Click Run at the bottom of the Run page.
The run uses the default settings: 5,000 trials, seed 20260802, Monte Carlo sampling. When the run ends, the Results page opens.
HomeInsertDrawPage LayoutFormulasDataReviewViewAutomateMonteGrid B4 =MC_OUTPUT(SUM('Cash Flow'!B12:L12),"Cumulative Free Cash Flow")A B C D E F 1 Measure Value Unit 2 Net present value 9.6 $M 3 Internal rate of return 10.8% % 4 Cumulative free cash flow 83.2 $M 5 6 7 8 9 10 11 12 13 14 15 16 17 18 19 20 21 22 23 24 25 26 27 28 29 30 31 32 AboutInputsCash FlowSummaryReadyAccessibility: Good to goMonteGrid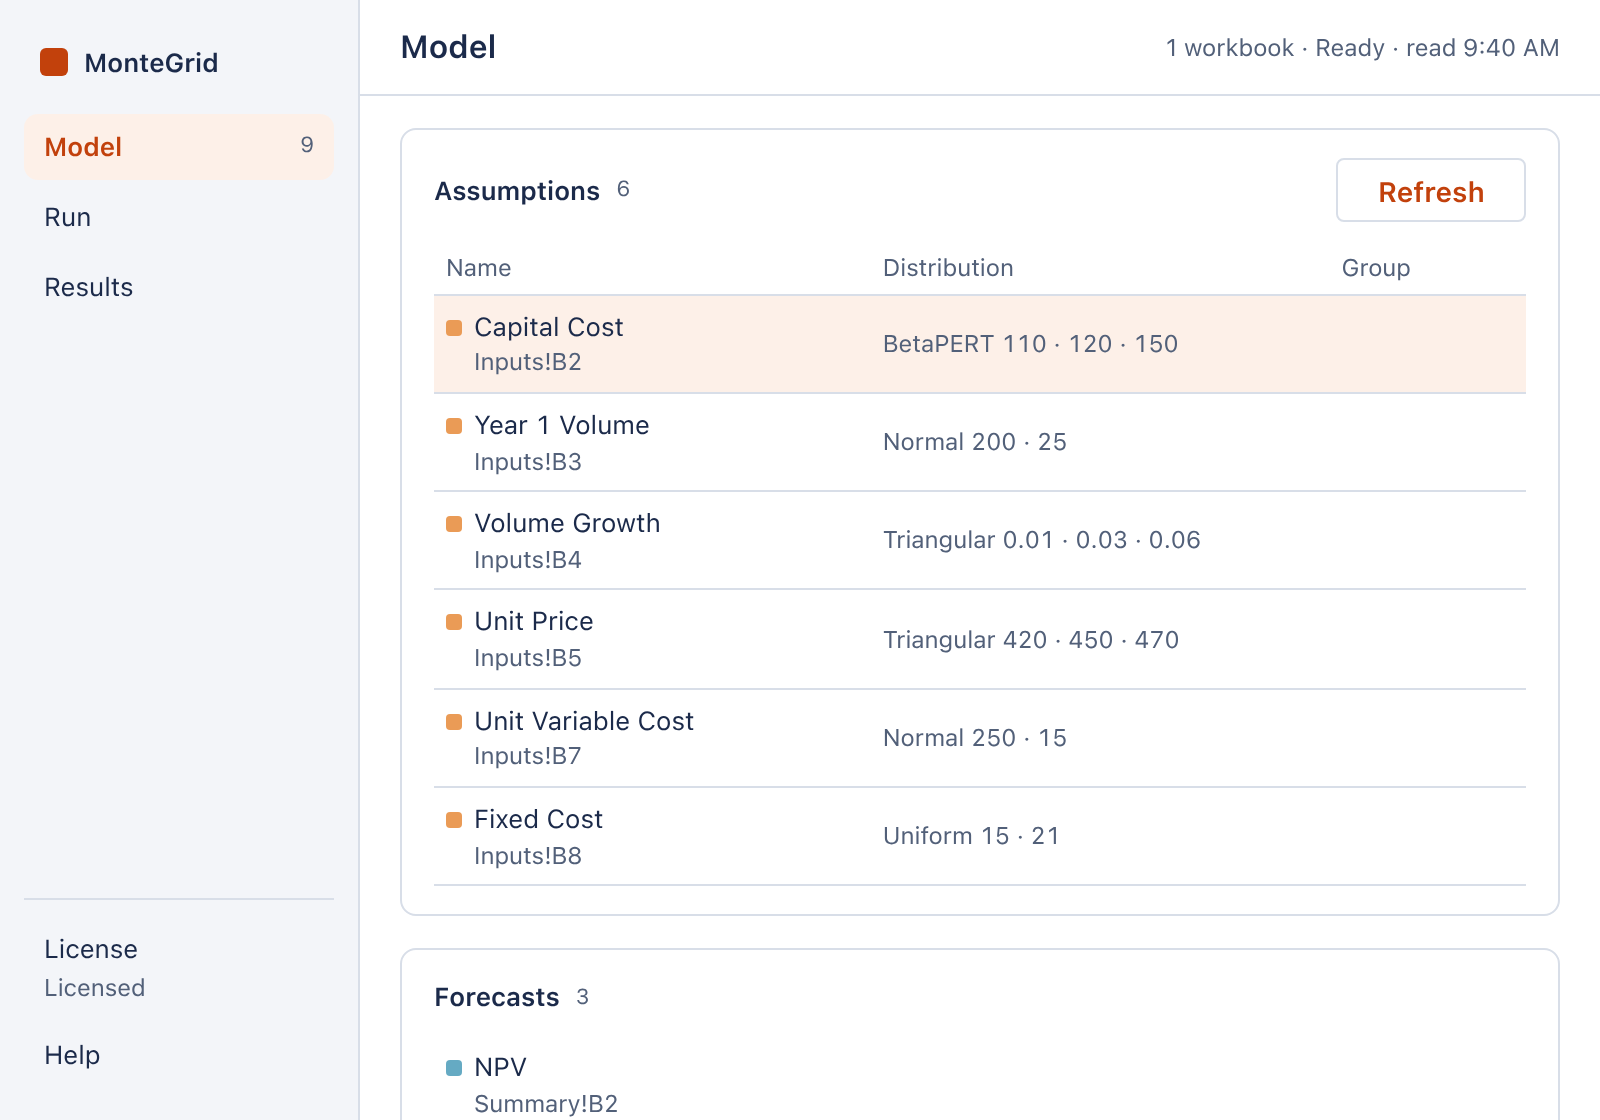
The Model page. The Model page. Open full size 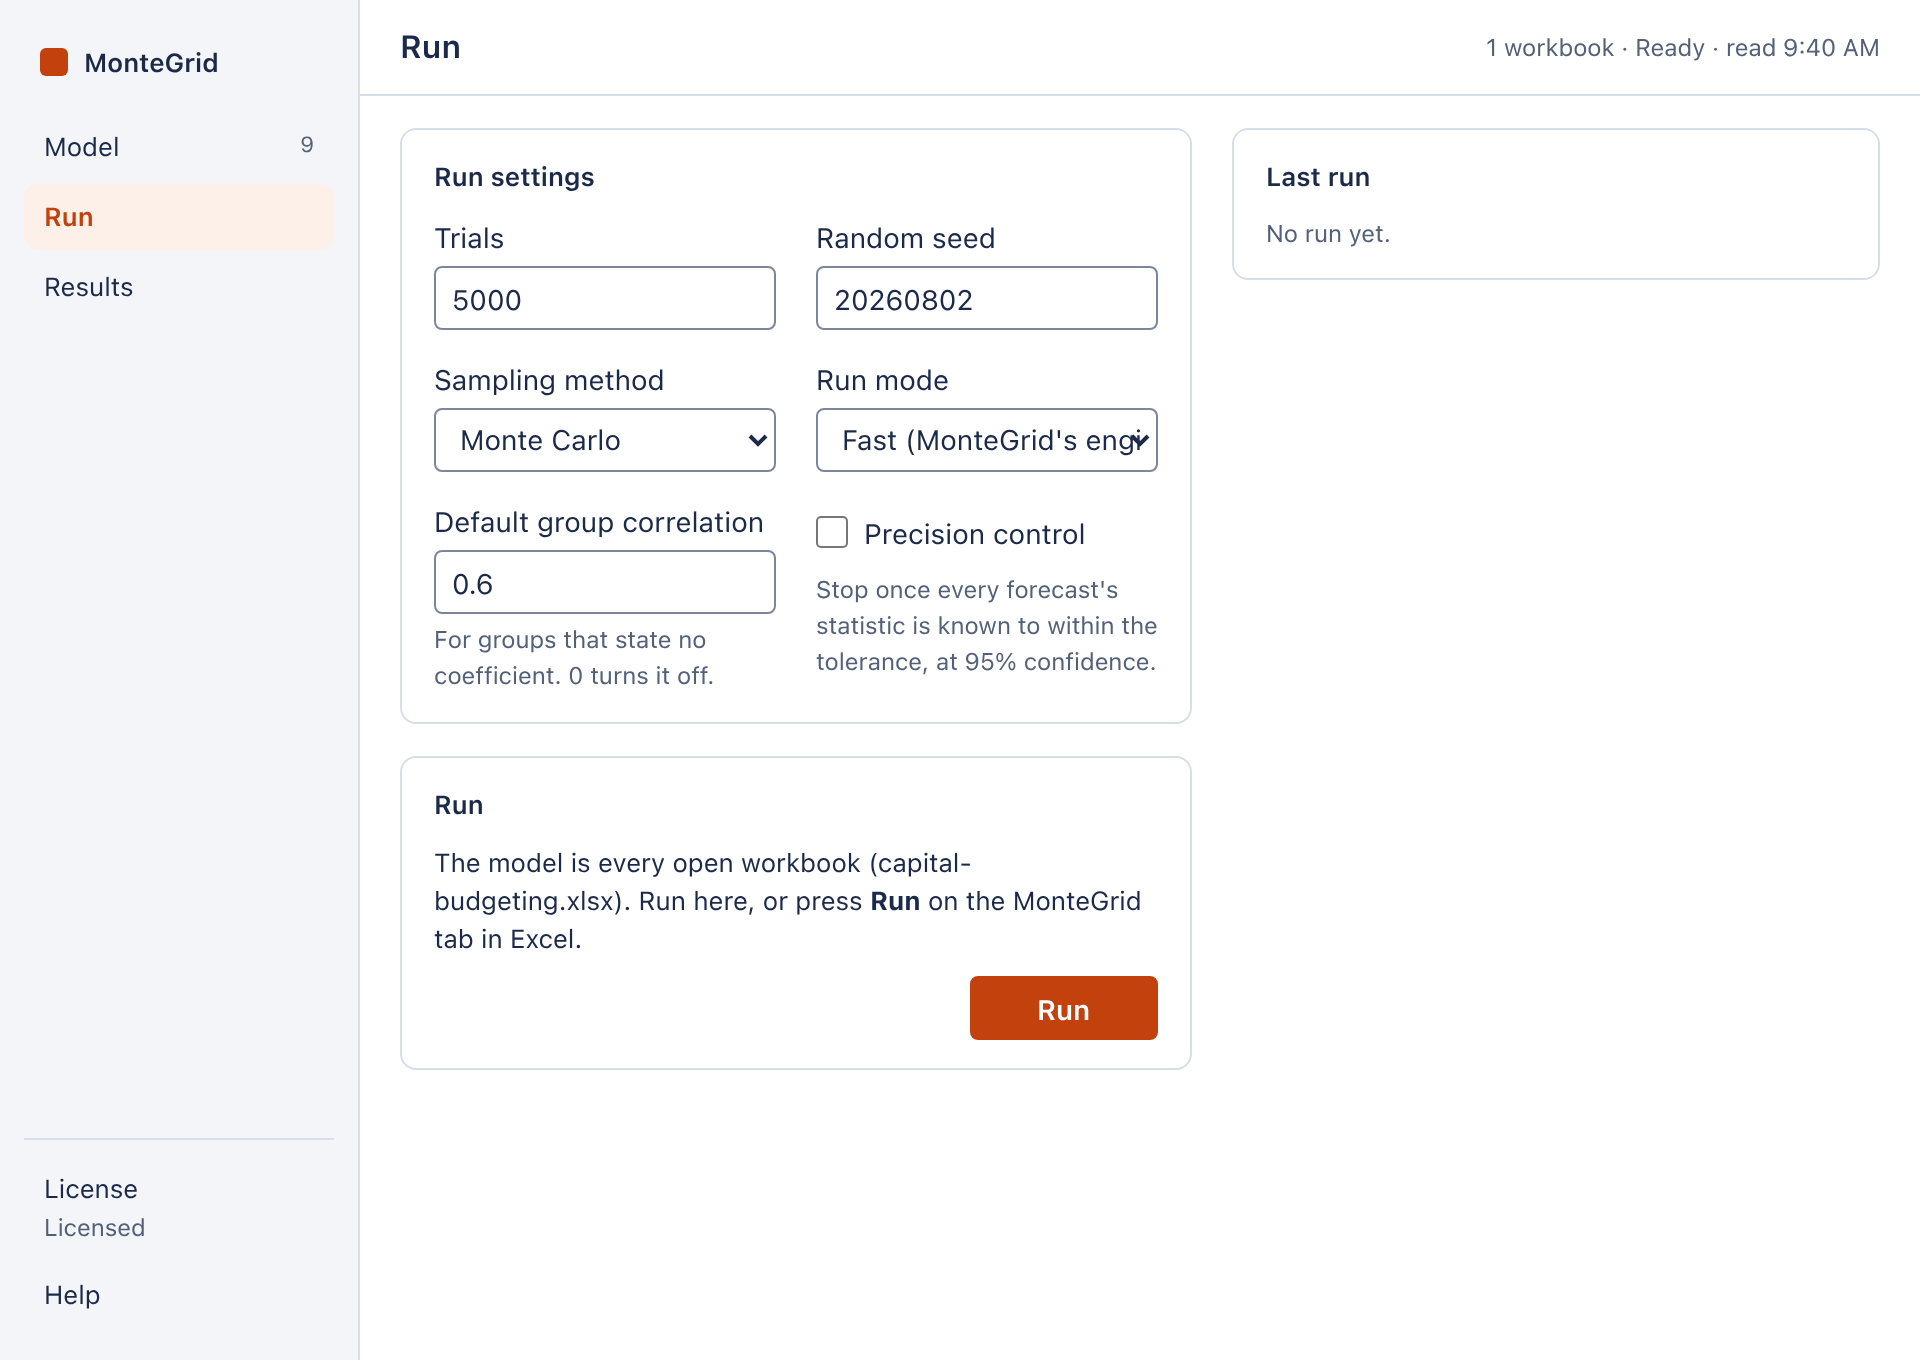
The Run page. Open full size -
6Review the NPV forecast
The NPV has a P10 of -$36.9M and a P90 of $50.6M, against a base case of $9.6M. Review the results describes each panel.
Save the workbook. The definitions are saved with it.
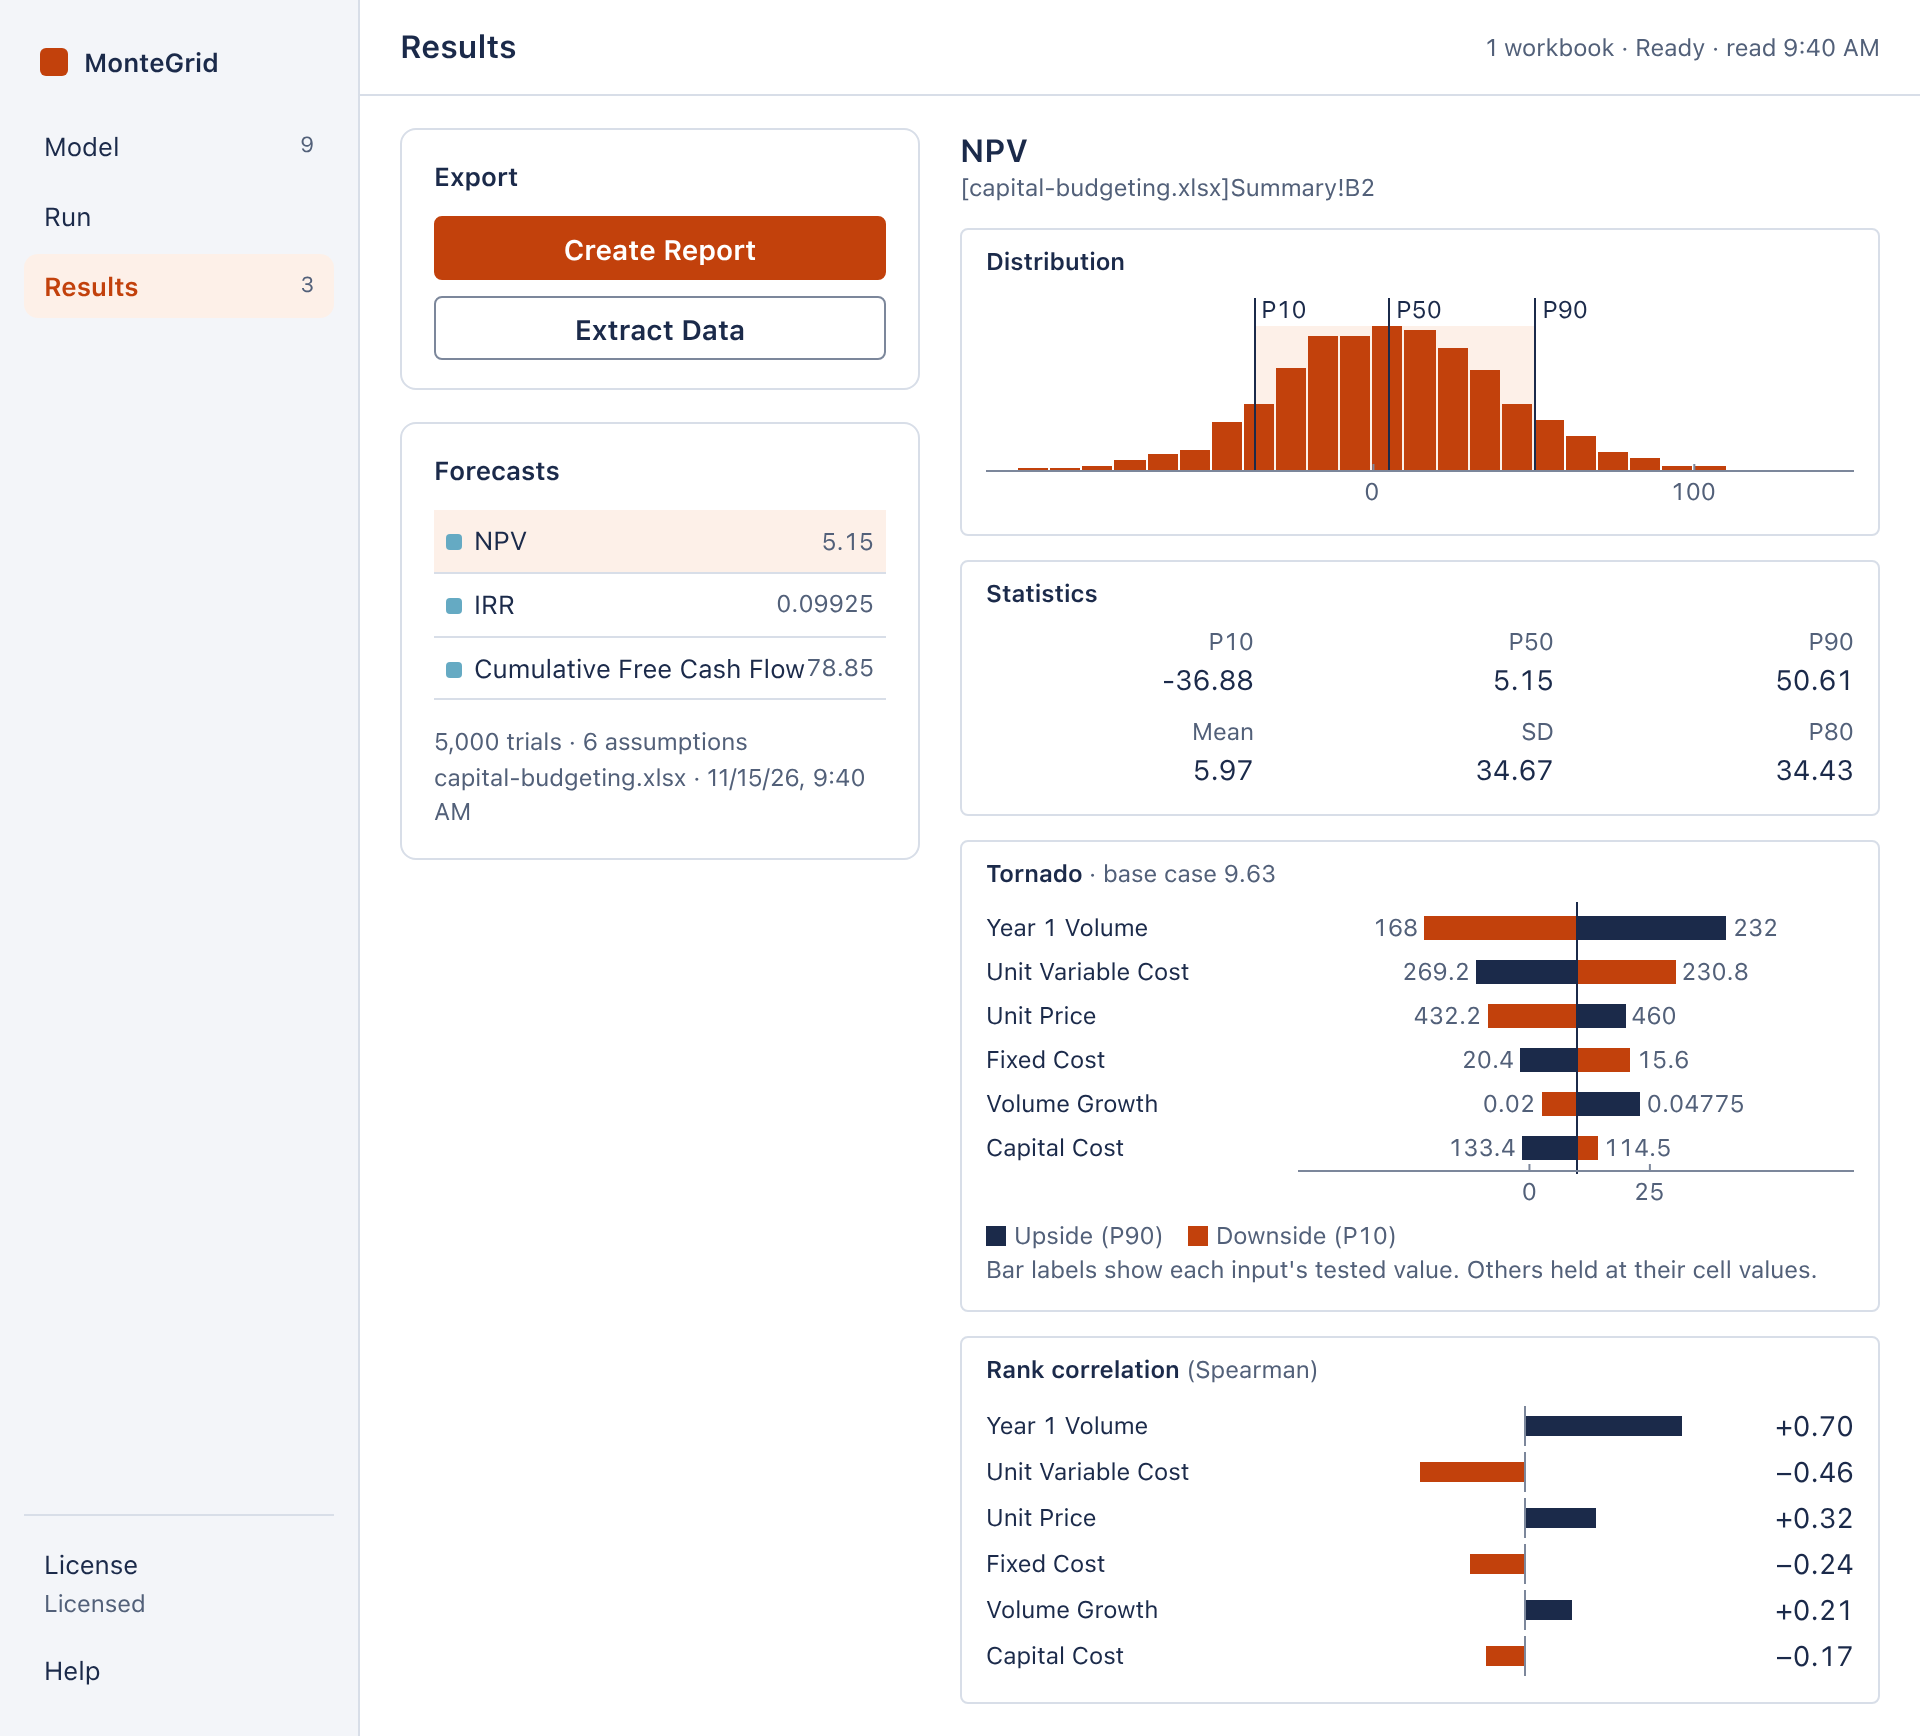
The NPV forecast. Open full size