MonteGrid | Tutorials | Correlate assumptions
Correlate assumptions
Correlate the demand inputs and the cost inputs, and compare the NPV with the uncorrelated run.
-
1Correlation groups
Year 1 Volume and Volume Growth both depend on demand. Unit Variable Cost and Fixed Cost both depend on input prices. The first run sampled them independently.
A correlation group applies one rank correlation coefficient to every pair of its assumptions. A group with no coefficient uses Default group correlation on the Run page, 0.6 by default. MonteGrid imposes rank correlations with the Iman–Conover method.
Continue with the workbook from Build a model and run a first simulation, or download it below.
-
2Create the Demand group
To put Volume Growth in a new group, Demand:
- Select Inputs!B4.
- On the MonteGrid tab, click Define Assumption. The dialog opens with the saved distribution.
- Click More: tails, correlation group, edit as text.
- Enter Demand in Correlation group.
- Click Save assumption.
The group name is the third argument of MC_STATIC: MC_STATIC(0.03,"Volume Growth","Demand").
HomeInsertDrawPage LayoutFormulasDataReviewViewAutomateMonteGrid


 B4 =MC_TRIANG(0.01,0.03,0.06,MC_STATIC(0.03,"Volume Growth",""))
A B C D E F G H I J K L M 1 Input Value Unit 2 Capital cost 120.0 $M 3 Year 1 volume 200.0 thousand units 4 Volume growth per year 3.0% % 5 Unit price, year 1 450.0 $ 6 Price change per year -1.0% % 7 Variable cost per unit 250.0 $ 8 Fixed cost per year 18.0 $M 9 Tax rate 25.0% % 10 Discount rate 9.0% % 11 Plant life 10 years 12 13 14 15 16 17 18 19 20 21 22 23 24 25 26 27 28 29 30 31 32 AboutInputsCash FlowSummaryReadyAccessibility: Good to goDefine Assumption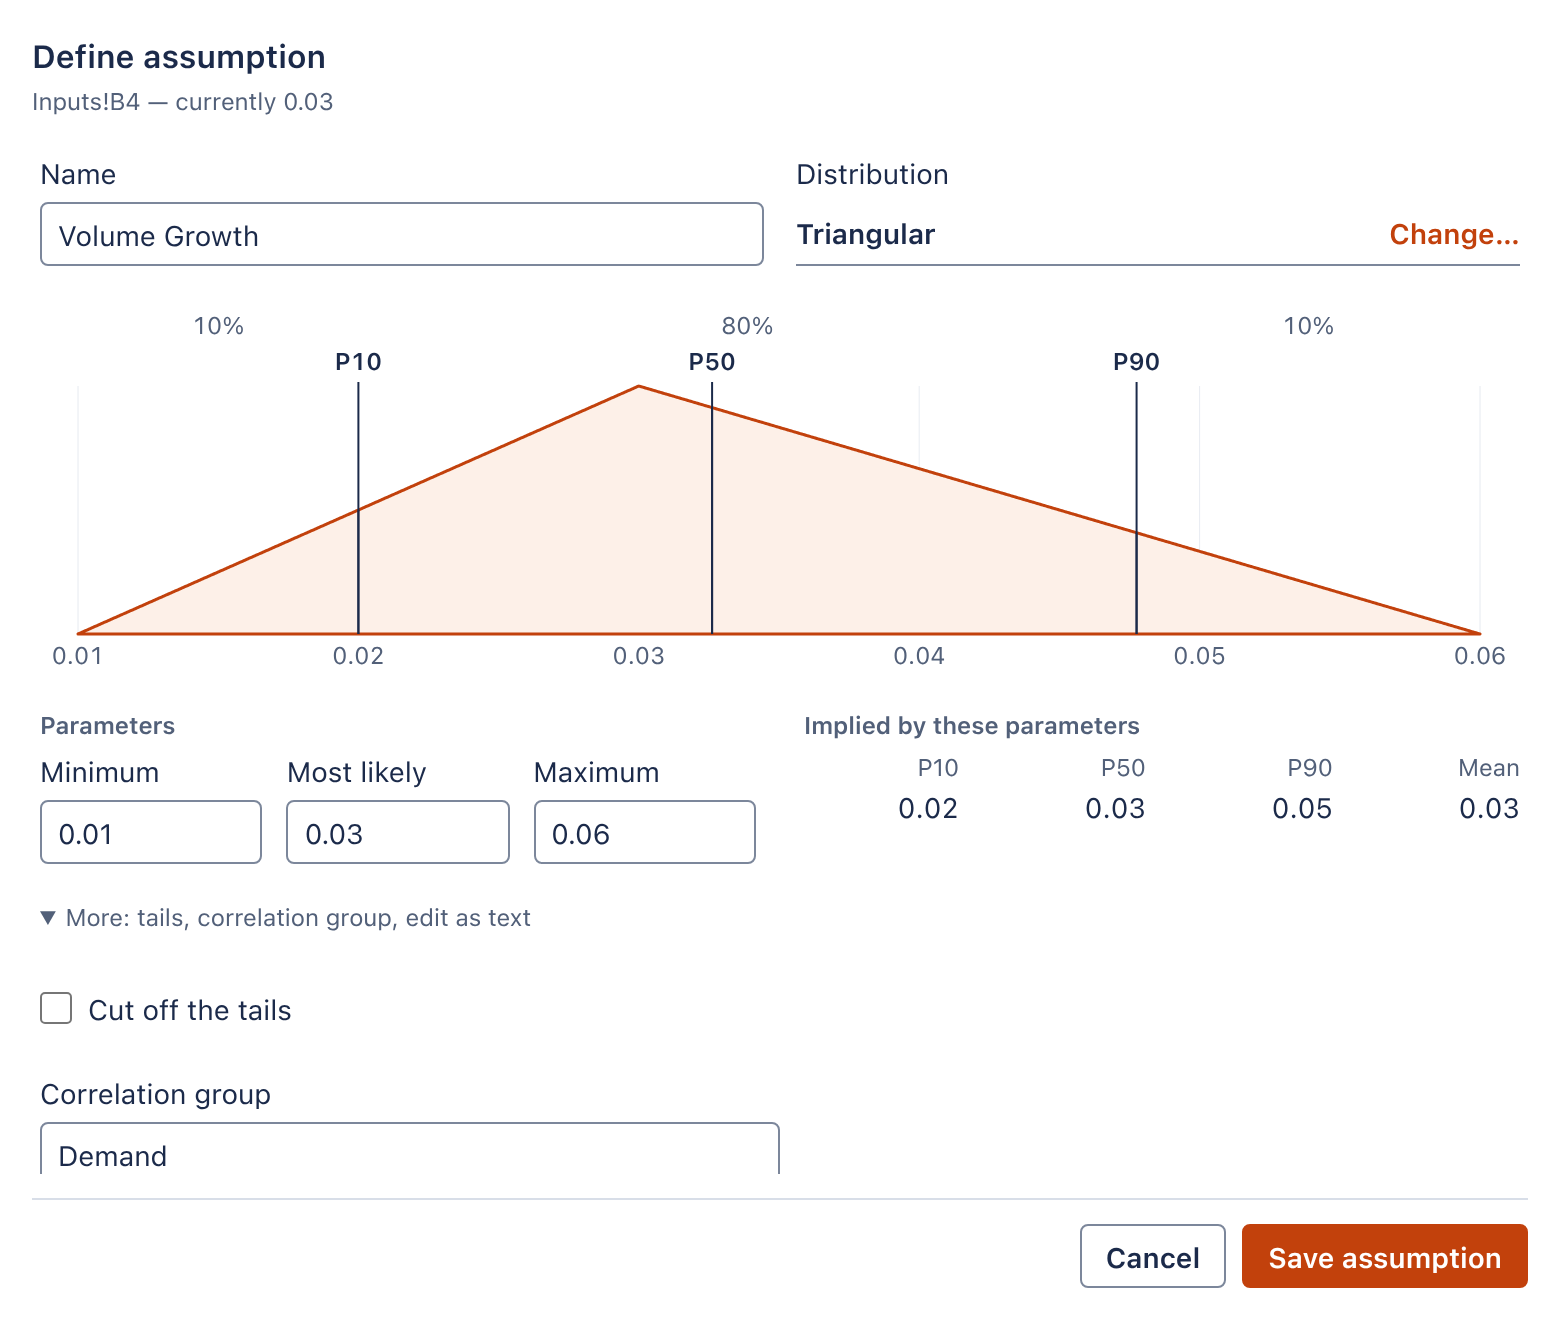
The Demand group. The Demand group. Open full size -
3Complete the groups on the Model page
To add the other assumptions:
- On the MonteGrid tab, click Open MonteGrid. The Correlation groups panel shows Demand with Volume Growth.
- Under Demand, select Year 1 Volume in Add assumption….
- Enter Costs in New group and click Add.
- Under Costs, select Unit Variable Cost, then Fixed Cost, in Add assumption….
Leave the coefficient boxes empty to use 0.6. Save the workbook.
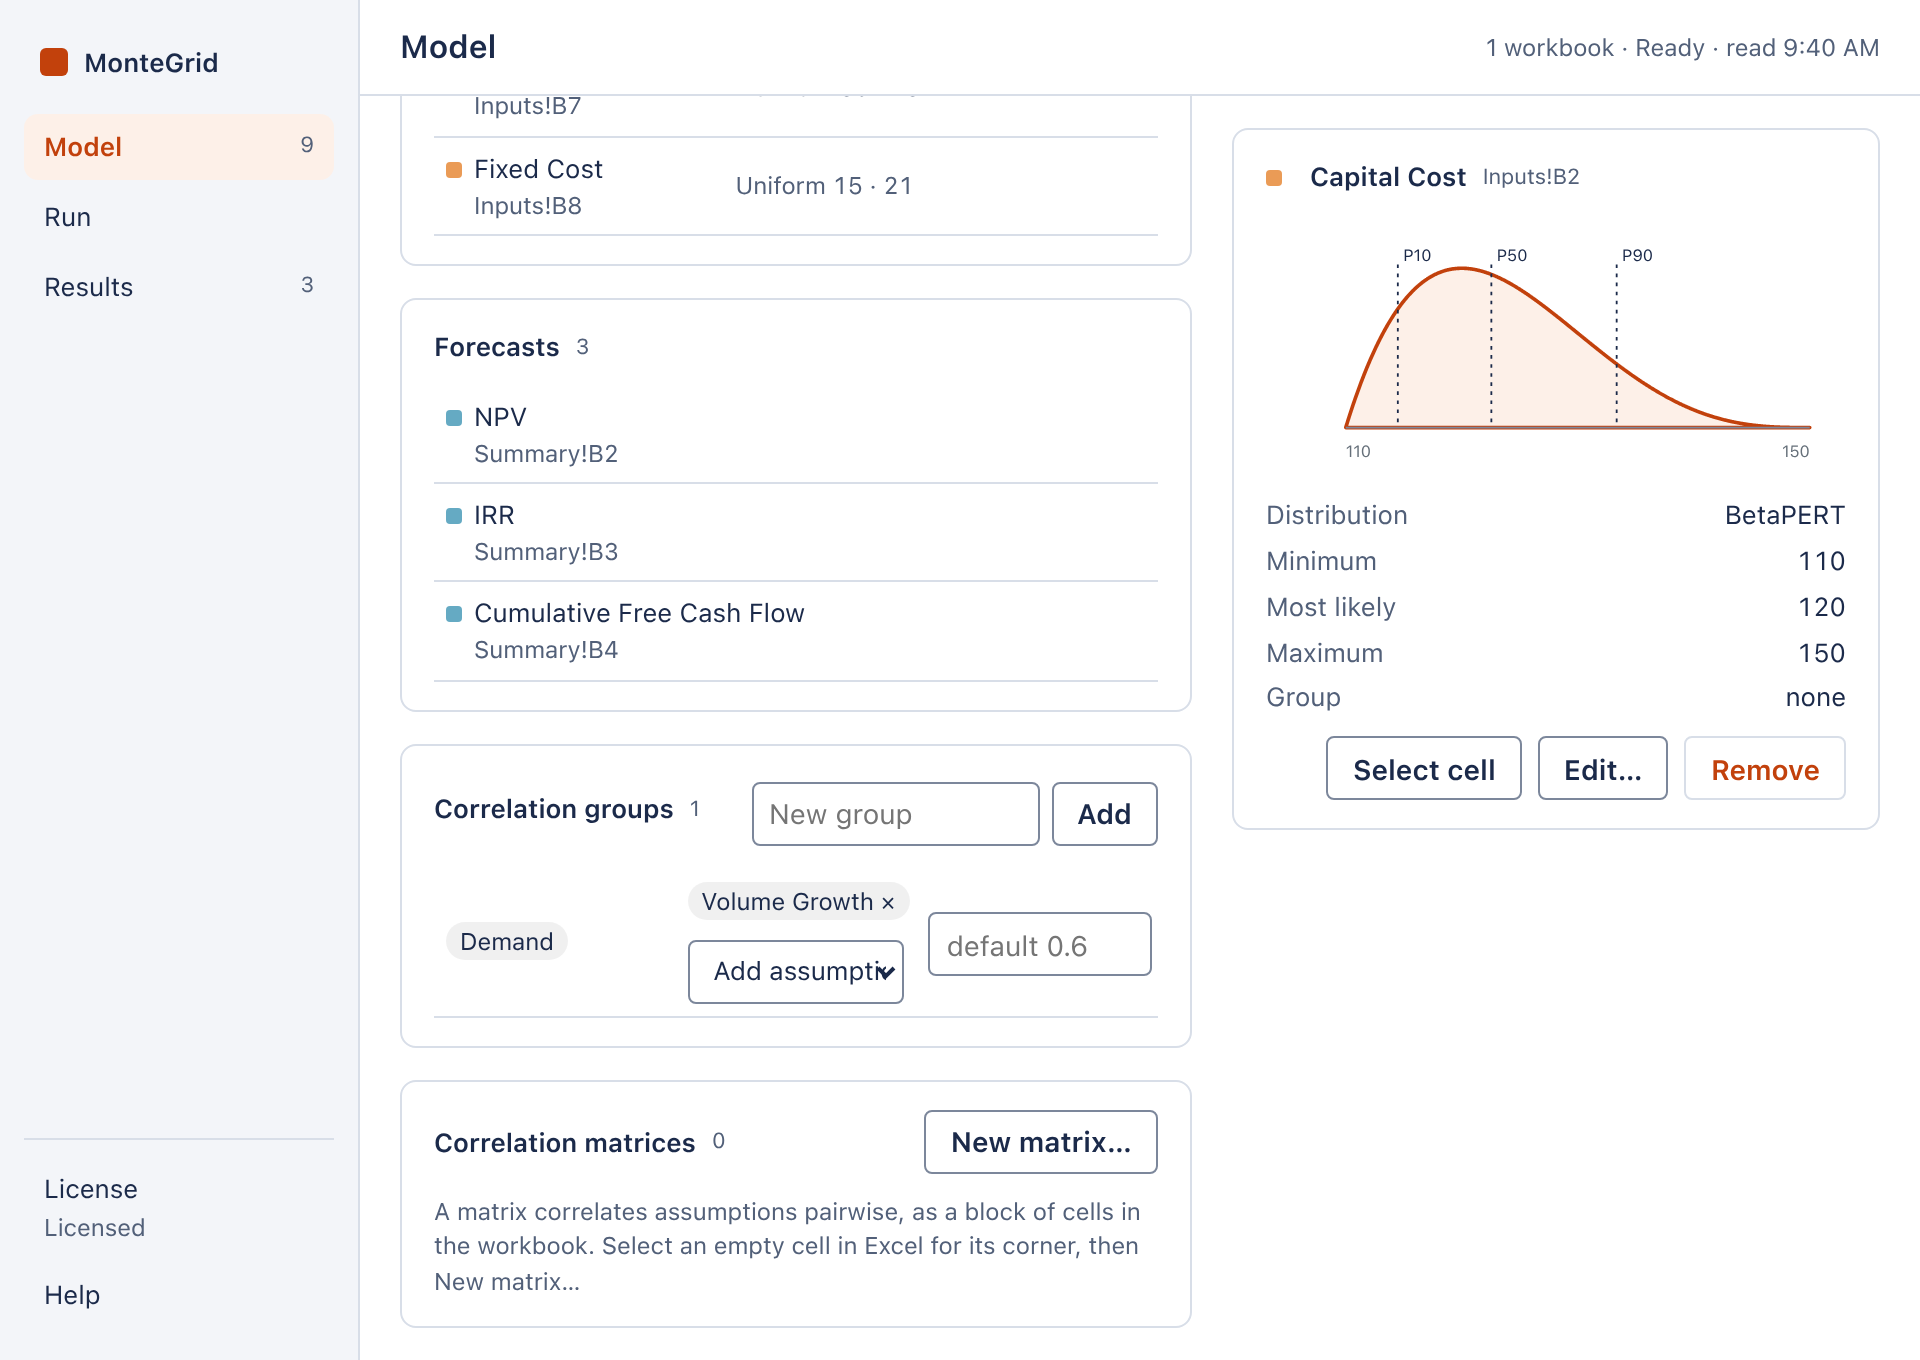
Correlation groups: Demand. Open full size 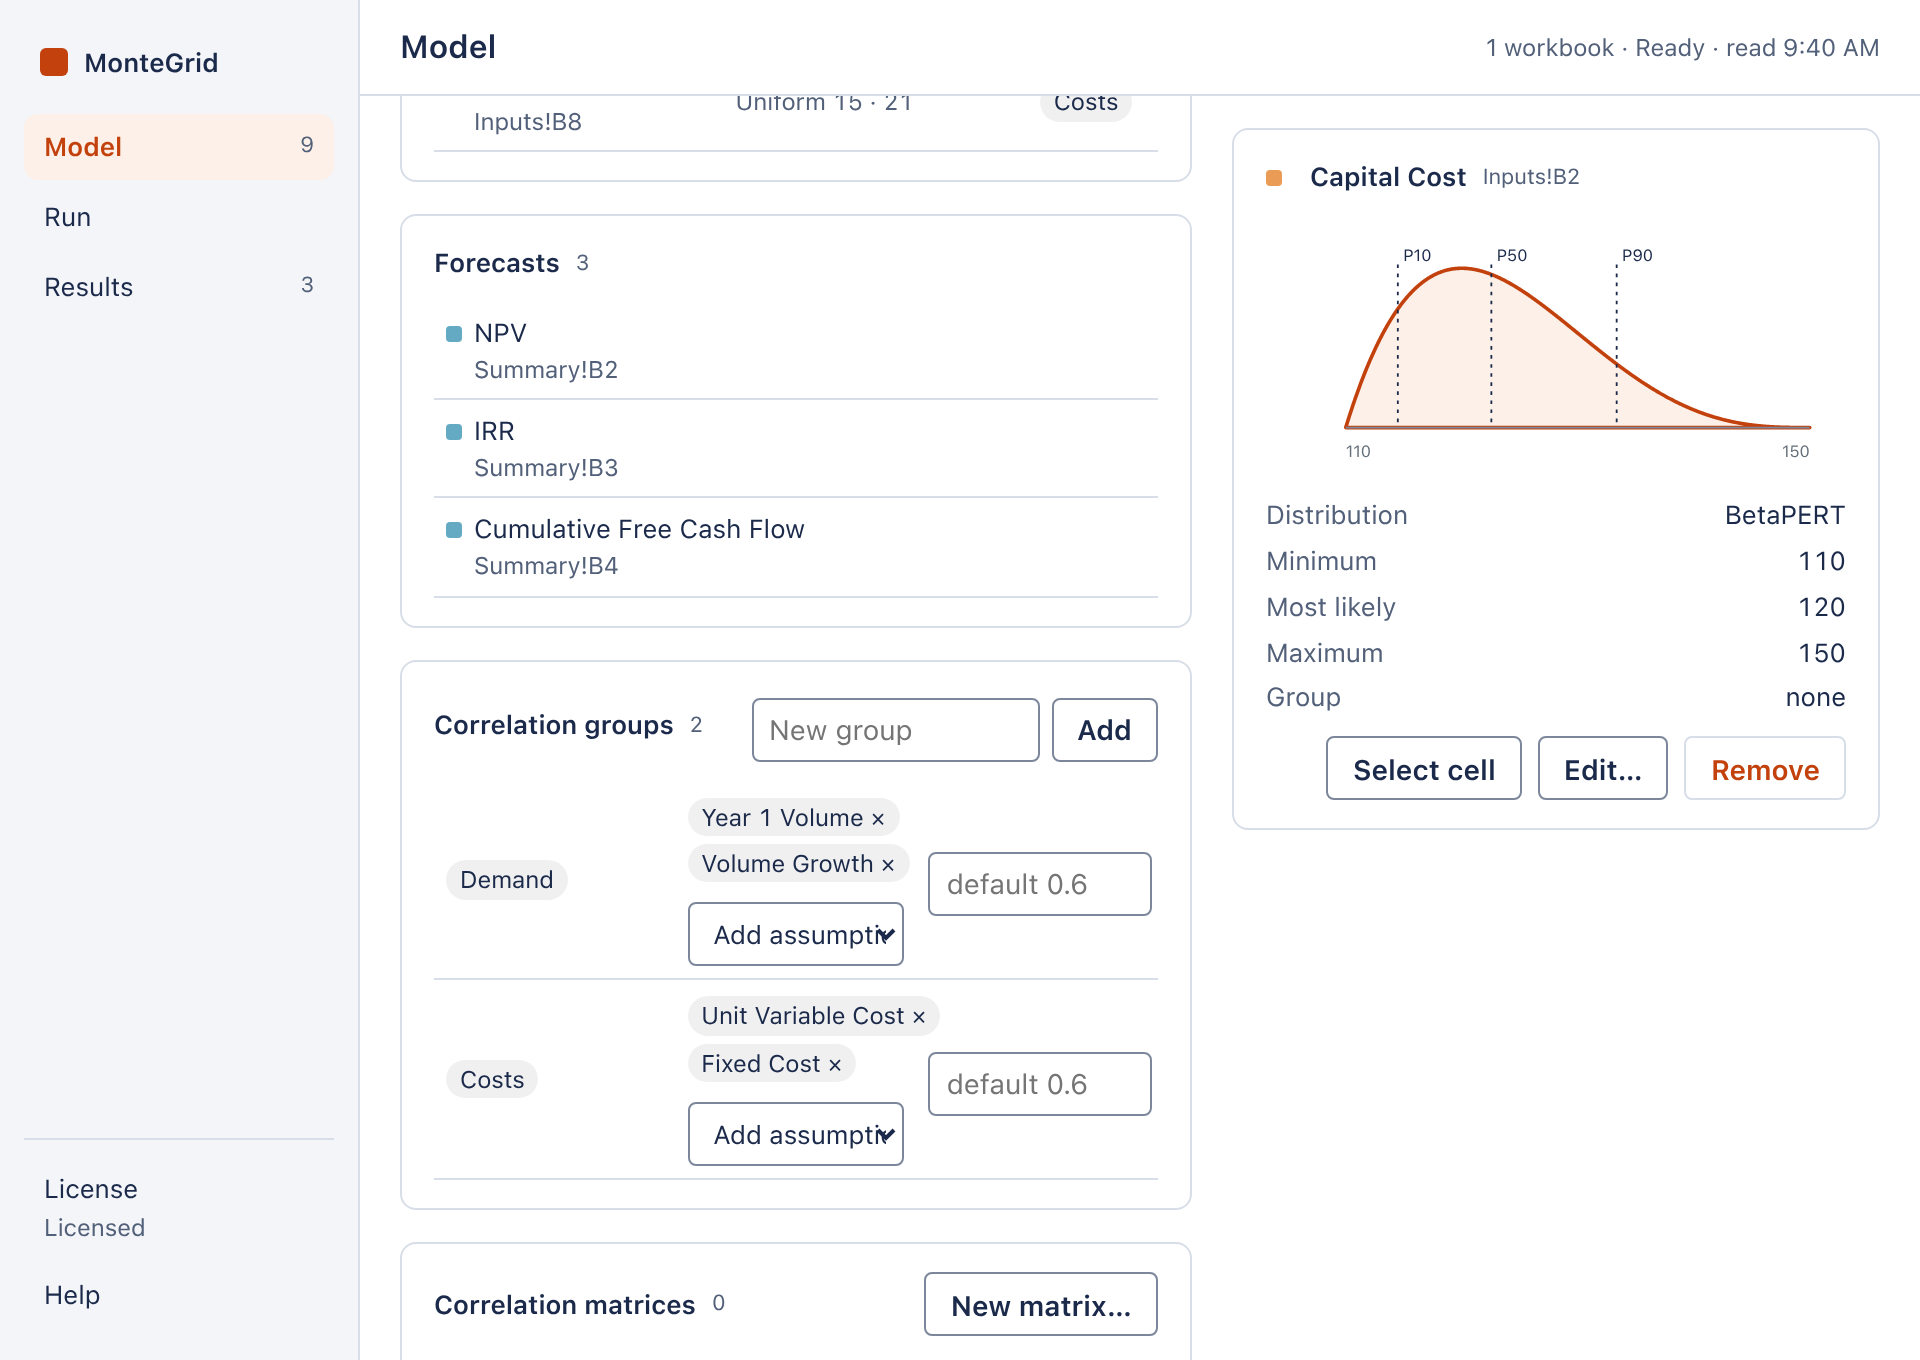
Correlation groups: Demand and Costs. Open full size -
4Run and compare
On the MonteGrid tab, click Run. The settings are unchanged, so only the correlation differs from the first run.
NPV ($M) Independent Correlated P10 -36.88 -42.76 P50 5.15 5.11 P90 50.61 59.30 SD 34.67 40.47 In the rank correlations, Volume Growth moves from fifth to second.
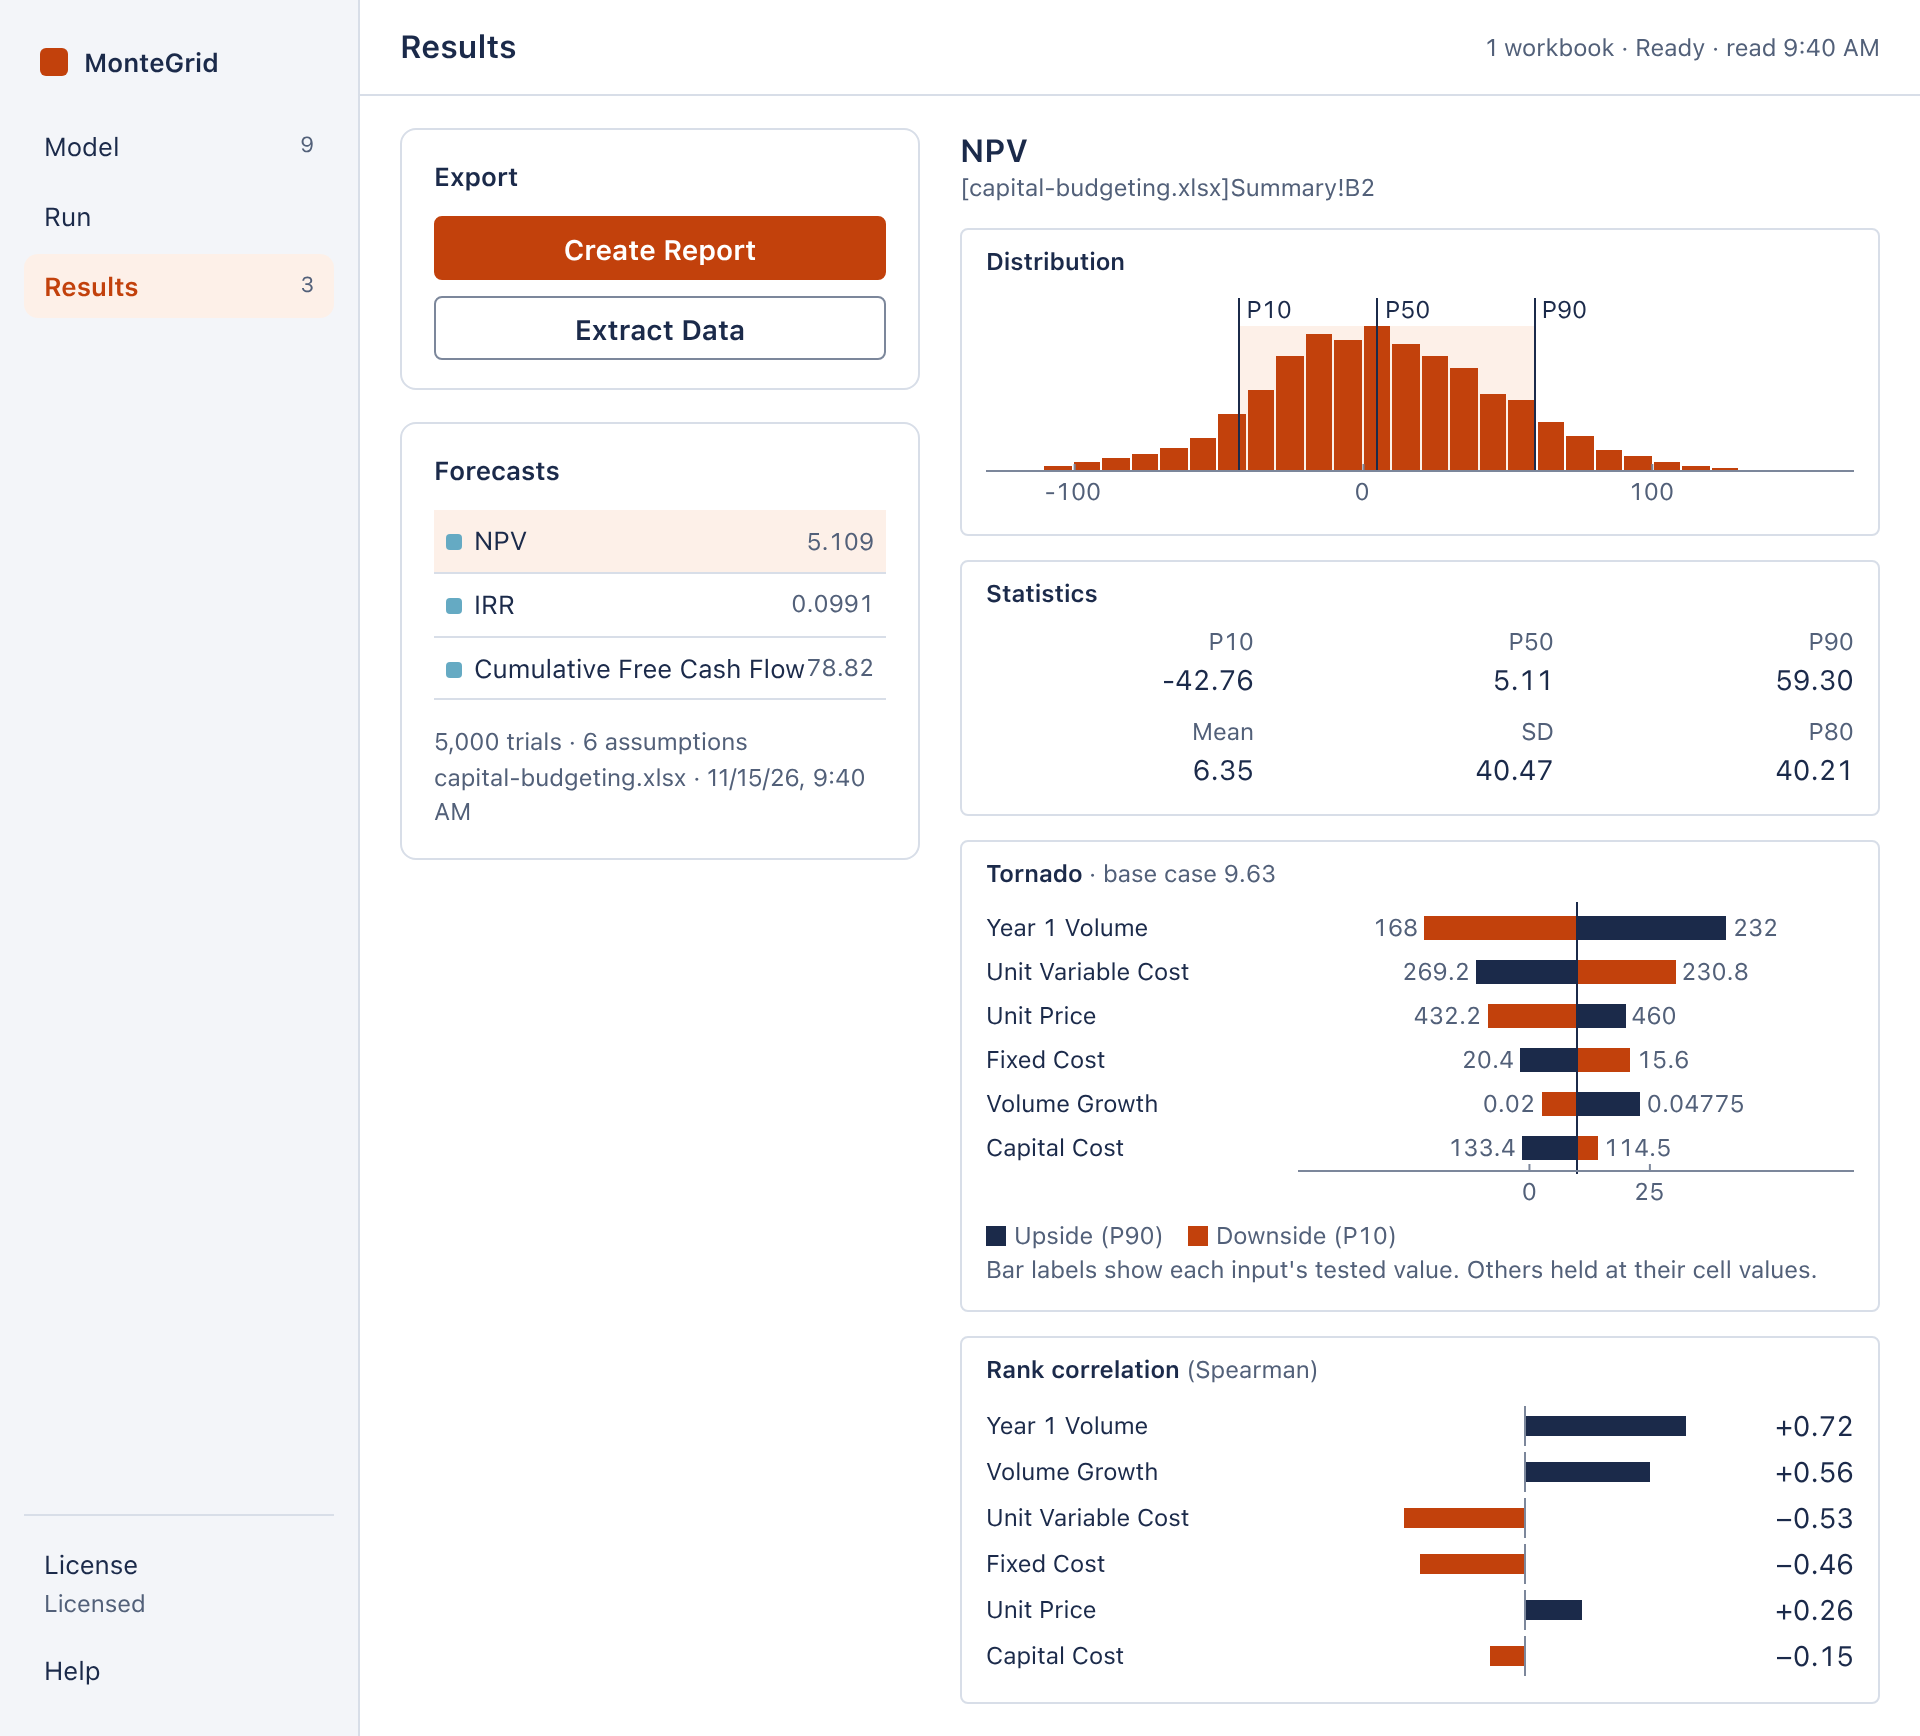
The NPV forecast with correlation. Open full size -
5Correlation matrices
A correlation matrix sets a coefficient for each pair of assumptions. An assumption can be in a group or in a matrix, not both. The model in these tutorials does not use a matrix.
To define a matrix:
- Select an empty cell for the top left corner of the matrix.
- On the MonteGrid tab, click Define Correlation.
- Enter a name and select the assumptions.
- Enter the coefficients in the upper triangle.
- Click Write matrix.
MonteGrid writes the matrix to the worksheet as a block: the name in the corner, the assumptions across and down, and the coefficients between them. If the coefficients cannot all hold, the dialog offers Adjust to nearest.